| Demographics of the United States | |
|---|---|
 Population pyramid of the United States in 2026 | |
| Population | 331,449,281 (2020 census)2 |
| Density | |
| Growth rate | |
| Birth rate | |
| Death rate | |
| Life expectancy | |
| • male | |
| • female | |
| Fertility rate | |
| Infant mortality rate | |
| Net migration rate | |
| Age structure | |
| Under 18 years | 21.5% (2024 est.)8 |
| 18–44 years | 36.0% (2023 est.)8 |
| 45–64 years | 24.6% (2023 est.)8 |
| 65 and over | 18% (2023 est.)8 |
| Sex ratio | |
| Total | 0.98 male(s)/female (2023 est.)8 |
| At birth | 1.045 male(s)/female (2022)9 |
| Under 15 | 1.05 male(s)/female (2023 est.)8 |
| 15–64 years | 1.01 male(s)/female (2023 est.)8 |
| 65 and over | 0.82 male(s)/female (2023 est.)8 |
| Nationality | |
| Nationality | American |
| Major ethnic |
|
| Minor ethnic |
|
| Language | |
| Official | English See: English was made the official language of the United States by Executive Order 14224 in 2025.1718 However, Congress has never passed a bill to designate English as the official language of all three federal branches. English is designated official in 32 of 50 states (and in all five U.S. territories). Hawaiian is official in Hawaii, 20 Native languages are official in Alaska, and Sioux is official in South Dakota.19 Samoan is an official language in American Samoa,20 Chamorro is an official language in Guam,21 Chamorro and Carolinian are official languages in the Northern Mariana Islands,22 and Spanish is an official language in Puerto Rico.23 |
| Spoken |
|
| Source: American Community Survey of U.S. Census Bureau24 | |
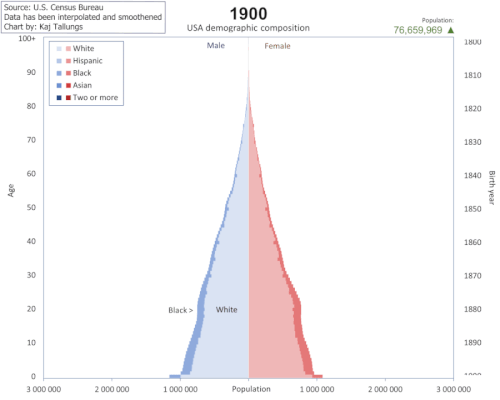
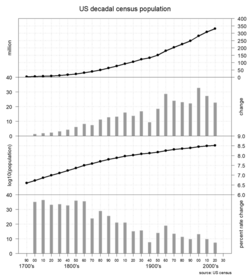
With about 4% of the world's population, the United States is the third most populous country (after India and China), and the most populous in the Americas and the Western Hemisphere. Its estimated population was 341,784,857 on July 1, 2025, according to the U.S. Census Bureau.1 The country's population grew by 1.8 million, or 0.5%, between 2024 and 2025, due to a decline in net international migration.25 The previous year, the Census Bureau had reported a population increase of 0.98% between 2023 and 2024,26 slightly below the global population growth rate of 1.03%.27 These figures include the 50 states and the federal capital, Washington, D.C., but exclude the 3.6 million residents of five unincorporated U.S. territories (Puerto Rico, Guam, the U.S. Virgin Islands, American Samoa, and the Northern Mariana Islands) as well as several minor uninhabited island possessions. By several metrics, including racial and ethnic background, religious affiliation, and percentage of rural and urban divide, the state of Illinois is the most representative of the larger demography of the United States.28
The United States population almost quadrupled during the 20th century, with an average growth rate of about 1.3% a year, from about 76 million in 1900 to 281 million in 2000.29 It is estimated to have reached the 200 million mark in 1967, and the 300 million mark on October 17, 2006.2930 Foreign-born immigration caused the U.S. population to continue its rapid increase, with this population doubling from almost 20 million in 1990 to over 45 million in 2015,31 representing one-third of the population increase.32 The U.S. Census Bureau reported in late 2024 that recent immigration to the United States had more than offset the country's lower birth rates: "Net international migration's influence on population trends has increased over the last few years. Since 2021, it accounted for the majority of the nation's growth—a departure from the last two decades, when natural increase was the main factor." This in turn led to an increase in the U.S. population in each of the years 2022, 2023, and 2024 (+0.58%, +0.83%, and +0.98% respectively). Net international migration slowed to a record low in 2025, however, and so did U.S. population growth during that year (+0.5%).3334
Population growth is fastest among minorities as a whole, and according to a 2020 U.S. Census Bureau analysis, 50% of U.S. children under the age of 18 are members of ethnic minority groups.35 As of 2020, white Americans numbered 235,411,507 or 71% of the population, including people who identified as white in combination with another race. People who identified as white alone (including Hispanic whites) numbered 204,277,273 or 61.6% of the population, while non-Latino whites made up 57.8% of the country's population.36
Latino Americans accounted for 51.1% of the country's total population growth between 2010 and 2020.37 The Hispanic or Latino population increased from 50.5 million in 2010 to 62.1 million in 2020, a 23% increase and a numerical increase of more than 11.6 million.37 Immigrants and their U.S.-born descendants are expected to provide most of the U.S. population gains in the decades ahead.38
Asian Americans are the fastest-growing racial group in the United States, with a growth rate of 35%. However, multiracial Asian Americans make up the fastest-growing subgroup, with a growth rate of 55%, reflecting the increase of mixed-race marriages in the United States.3940
As of 2026 provisional data, births to White American mothers remain around 50% of the U.S. total. Continuing declines in the fertility rates among Black American and Asian American mothers, with both groups dropping well below the US average, has led to a slow decline in the total fertility rate since 2020. The US continues to have one of the highest fertility rates among the high income countries.41
Population
| Census | Pop. | Note | %± |
|---|---|---|---|
| 1790 | 3,929,326 | — | |
| 1800 | 5,308,483 | 35.1% | |
| 1810 | 7,239,881 | 36.4% | |
| 1820 | 9,638,453 | 33.1% | |
| 1830 | 12,866,020 | 33.5% | |
| 1840 | 17,069,453 | 32.7% | |
| 1850 | 23,191,876 | 35.9% | |
| 1860 | 31,443,321 | 35.6% | |
| 1870 | 38,925,598 | 23.8% | |
| 1880 | 50,189,209 | 28.9% | |
| 1890 | 62,979,766 | 25.5% | |
| 1900 | 76,212,168 | 21.0% | |
| 1910 | 92,228,496 | 21.0% | |
| 1920 | 106,021,537 | 15.0% | |
| 1930 | 122,775,046 | 15.8% | |
| 1940 | 132,164,569 | 7.6% | |
| 1950 | 150,697,361 | 14.0% | |
| 1960 | 179,323,175 | 19.0% | |
| 1970 | 203,392,031 | 13.4% | |
| 1980 | 226,545,805 | 11.4% | |
| 1990 | 248,709,873 | 9.8% | |
| 2000 | 281,421,906 | 13.2% | |
| 2010 | 308,745,538 | 9.7% | |
| 2020 | 331,449,281 | 7.4% | |
| 2025 (est.) | 341,784,857 | 42 | 3.1% |
| U.S. Decennial Census | |||
In 1900, when the U.S. population was 76 million, there were 66.8 million white Americans in the United States, representing 88% of the total population,43 8.8 million Black Americans, with about 90% of them still living in Southern states,44 and slightly more than 500,000 Hispanics.45
Under federal law, the Immigration and Nationality Act of 1965,46 the number of first-generation immigrants living in the United States has increased,47 from 9.6 million in 1970 to about 38 million in 2007.48 Around a million people legally immigrated to the United States per year in the 1990s, up from 250,000 per year in the 1950s.49
In 1900, non-Hispanic whites comprised almost 97% of the population of the 10 largest U.S. cities.50 The Census Bureau reported that minorities (including Hispanic whites) made up 50.4% of the children born in the U.S. between July 2010 and July 2011,51 compared to 37% in 1990.52
In 2014, the state with the lowest fertility rate was Rhode Island, with a rate of 1.56, while Utah had the greatest rate with a rate of 2.33.53 This correlates with the ages of the states' populations: Rhode Island has the ninth-oldest median age in the US – 39.2 – while Utah has the youngest – 29.0.54
In 2017, the U.S. birth rate remains well below the replacement level needed – at least 2.1 children per woman so as not to experience population decreases – as white American births fell in all 50 states and the District of Columbia. Among non-Hispanic white women, no states had a fertility rate above the replacement level. Among non-Hispanic Black women, 12 states reached above the replacement level needed. Among Hispanic women, 29 states did.55 For non-Hispanic white women, the highest total fertility rate was in Utah, at 2.099, and the lowest in the District of Columbia, at 1.012. Among non-Hispanic Black women, the highest total fertility rate was in Maine, at 4.003, and the lowest in Wyoming, at 1.146. For Hispanic women, the highest total fertility rate was in Alabama, at 3.085, and the lowest in Vermont, at 1.200, and Maine, at 1.281.5556 As of 2016, due to aging, low birth rates and rising mortality driven partly by drug overdoses, deaths outnumber births among non-Hispanic whites in more than half the states in the country.57
Growth rate
-2.00% or less
-0.01% to -1.99%
0% to 0.99%
1% to 2.49%
2.5% to 4.99%
5% to 8.99%
9% to 11.99%
12% or more
source ↗- U.S. population growth rates: 0.98% (2024), 0.83% (2023), 0.58% (2022), 0.16% (2021), 0.41% (2020)26
Age and sex distribution
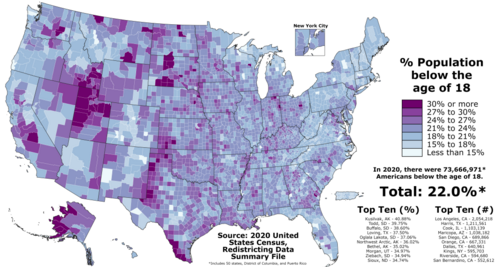
Proportion of Americans under the age of 18 in each county of the fifty states, the District of Columbia, and Puerto Rico as of the 2020 United States census
source ↗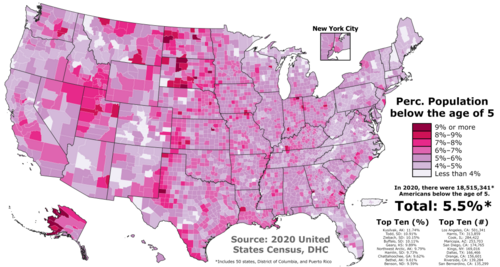
Proportion of Americans under the age of 5 in each county of the fifty states, the District of Columbia, and Puerto Rico as of the 2020 United States census
source ↗Sex distribution
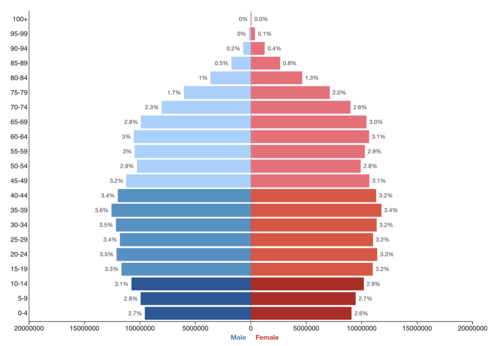
The 2020 U.S. Census reported there were more females than males with females making up 50.9% (or 168,763,470 people) of the population and males making up 49.1% (or 162,685,811 people). The previous census in 2010 also reported that there were more females than males; but females made up slightly less of the population at 50.8% and males made slightly more at 49.2%.59
The first U.S. Census to report more females than males was the 1950 Census.60
| Age (years) |
Total (thousands) |
% of U.S. pop. | Males (thousands) |
Females (thousands) |
% male | % female | Sex ratio (males per female) |
|---|---|---|---|---|---|---|---|
| 0 | 3,564 | 1.1% | 1,822 | 1,743 | 51.1% | 48.9% | 1.05 |
| < 5 | 18,827 | 5.7% | 9,624 | 9,203 | 51.1% | 48.9% | 1.05 |
| < 15 | 60,467 | 18.2% | 30,989 | 29,578 | 51.2% | 48.8% | 1.05 |
| 15-24 | 43,089 | 13.0% | 21,996 | 21,092 | 51.0% | 49.0% | 1.04 |
| 25-34 | 45,495 | 13.7% | 23,053 | 22,442 | 50.7% | 49.3% | 1.03 |
| 35-44 | 43,404 | 13.1% | 21,858 | 21,546 | 50.4% | 49.6% | 1.01 |
| 45-54 | 40,688 | 12.3% | 20,312 | 20,376 | 49.9% | 50.1% | 0.99 |
| 55-64 | 42,803 | 12.9% | 20,963 | 21,840 | 49.0% | 51.0% | 0.96 |
| 65+ | 55,848 | 16.8% | 25,214 | 30,634 | 45.1% | 54.9% | 0.82 |
| 75+ | 22,182 | 6.7% | 9,344 | 12,837 | 42.1% | 57.9% | 0.73 |
| 85+ | 5,976 | 1.8% | 2,176 | 3,800 | 36.4% | 63.6% | 0.57 |
| 100+ | 98 | 0.03% | 25 | 73 | 25.5% | 74.5% | 0.34 |
| Total | 331,894 | 100% | 164,385 | 167,509 | 49.5% | 50.5% | 0.98 |
Note that this table shows some people in more than one group: for example someone aged 90 is included three times: in "65+", "75+" and "85+".
| Age Group | Percentage |
|---|---|
| 0–14 years | 18.2% |
| 15–24 years | 13.0% |
| 25–54 years | 39.0% |
| 55–64 years | 12.9% |
| 65 years and over | 16.8% |
Percent distribution of the total population by age: 1900 to 2015
Sources: U.S. Census Bureau, U.S. Department of Commerce, United Nations medium variant projections62
Percent distribution of the total population by age groups (1900 to 2015)
| Ages | 1900 | 1910 | 1920 | 1930 | 1940 | 1950 | 1960 | 1970 | 1980 | 1990 | 2000 | 2010 | 2015 |
|---|---|---|---|---|---|---|---|---|---|---|---|---|---|
| 0–14 years | 34.5 | 32.1 | 31.8 | 29.4 | 25.0 | 26.9 | 31.1 | 28.5 | 22.6 | 21.5 | 21.4 | 20.2 | 19.8 |
| 15–24 years | 19.6 | 19.7 | 17.7 | 18.3 | 18.2 | 14.7 | 13.4 | 17.4 | 18.8 | 14.8 | 13.9 | ||
| 25–44 years | 28.1 | 29.2 | 29.6 | 29.5 | 30.1 | 30.0 | 26.2 | 23.6 | 27.7 | 32.5 | 30.2 | ||
| 45–64 years | 13.7 | 14.6 | 16.1 | 17.5 | 19.8 | 20.3 | 20.1 | 20.6 | 19.6 | 18.6 | 22.0 | ||
| 65 years and over | 4.1 | 4.3 | 4.7 | 5.4 | 6.8 | 8.1 | 9.2 | 9.9 | 11.3 | 12.6 | 12.4 | 13.0 | 14.3 |
| Total (%) | 100 | 100 | 100 | 100 | 100 | 100 | 100 | 100 | 100 | 100 | 100 | 33.2 | 34.1 |
Dependency ratio
The dependency ratio is the age-population ratio of people who are normally not in the labor force (the dependent population, which includes those aged 0 to 14 and 65 and older) to those who are (the productive part, ages 15 to 64). It is used to gauge the strain on the populace that is productive. The support ratio is the ratio of the working-age population to the elderly population, that is, the reciprocal of the aged dependency ratio.
| Category | Global ranking | References |
|---|---|---|
| Total dependency ratio | 110th | 6163 |
| Child dependency ratio | 138th | 61 |
| Aged dependency ratio | 42nd | 61 |
| Potential support ratio | 160th | 61 |
Density
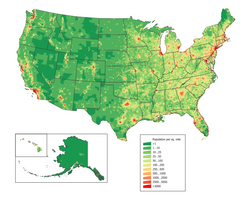
Number of persons per square mile in the United States in 2010
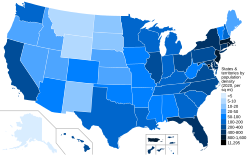
States and territories in the United States by population per square mile, according to the 2020 United States census

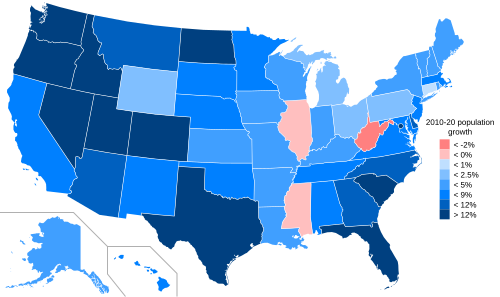
Counties in the United States by population growth since 2010 according to the U.S. Census Bureau 2018 Annual Estimate of the Resident Population.64 Counties with population growth greater than the United States as a whole are in dark green, counties with population growth slower than the United States in light green, and counties with declining populations in light red.
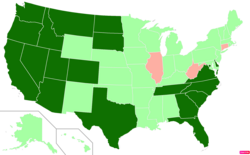
States in the United States by population growth since 2010 according to the U.S. Census Bureau 2018 Annual Estimate of the Resident Population.64 States with population growth greater than the United States as a whole are in dark green, states with population growth slower than the United States in light green, and states with declining populations in light red.
The most densely populated state is New Jersey (1,263/mi2 or 488/km2).
The population is highly urbanized, with 83.3% of the population residing in cities and suburbs.7 Large urban clusters are spread throughout the eastern half of the United States (particularly the Great Lakes area, northeast, east, and southeast) and the western tier states; mountainous areas, principally the Rocky Mountains and Appalachian chain, deserts in the southwest, the dense boreal forests in the extreme north, and the central prairie states are less densely populated; Alaska's population is concentrated along its southern coast – with particular emphasis on the city of Anchorage – and Hawaii's is centered on the island of Oahu.7 California and Texas are the most populous states, as the mean center of U.S. population has consistently shifted westward and southward.6566 New York City is the most populous city in the United States67 and has been since at least 1790.
In the U.S. territories, population centers include the San Juan metro area in Puerto Rico,68 Saipan in the Northern Mariana Islands,69 and the island of Tutuila in American Samoa.70
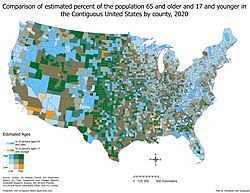
Median age of the population

Median Age by County 2022
46 or more
43 to 45.9
39 to 42.9
35 to 39.9
34.9 or less
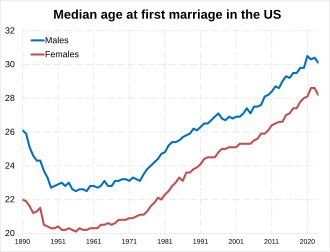
source ↗The median age of the total population as of 2021 is 38.8 years; the male median age is 37.7 years; the female median age is 39.8 years.61
Median age of the U.S. population through history. Source: U.S. Department of Commerce. Bureau of Census, United States Census Bureau and The World Factbook.7172
| Years | Median age of males | Median age of females | Median age of the total population |
|---|---|---|---|
| 1820 | 16.6 | 16.8 | 16.7 |
| 1830 | 17.2 | 17.3 | 17.2 |
| 1840 | 17.9 | 17.8 | 17.8 |
| 1850 | 19.2 | 18.6 | 18.9 |
| 1860 | 19.8 | 19.1 | 19.4 |
| 1870 | 20.2 | 20.1 | 20.2 |
| 1880 | 21.2 | 20.7 | 20.9 |
| 1890 | 22.3 | 21.6 | 22.0 |
| 1900 | 23.3 | 22.4 | 22.9 |
| 1910 | 24.6 | 23.5 | 24.1 |
| 1920 | 25.8 | 24.7 | 25.3 |
| 1930 | 26.7 | 25.2 | 26.5 |
| 1940 | 29.1 | 29.0 | 29.0 |
| 1950 | 29.9 | 30.5 | 30.2 |
| 1960 | 28.7 | 30.4 | 29.6 |
| 1970 | 26.8 | 29.8 | 28.1 |
| 1980 | 28.8 | 31.2 | 30.0 |
| 1990 | 31.7 | 34.1 | 32.9 |
| 2000 | 34.0 | 36.5 | 35.3 |
| 2010 | 35.8 | 38.5 | 37.2 |
| 2018 | 36.9 | 37.7 | 38.2 |
| 2021 | 37.7 | 39.8 | 38.8 |
Population centers
The United States has dozens of major cities, including 31 "global cities"73 of all types, with 10 in the "alpha" group of global cities: New York, Los Angeles, Chicago, Washington, D.C., Boston, San Francisco, Miami, Philadelphia, Dallas, and Atlanta.74 As of 2021, the United States had 56 metropolitan areas with 1 million or more inhabitants. (The U.S. Census Bureau ranked Urban Honolulu as the 56th most populous area, with just over 1 million residents.)
As of 2011, about 250 million Americans live in or around urban areas. That means more than three-quarters of the U.S. population shares just about three percent of the U.S. land area.75
Population by year (includes estimates)
This table includes the official United States population by year from the U.S. Census Bureau, and includes the Bureau's intercensal estimates. Such estimates are taken on July 1 of each year but are not included for the years of the decennial census (2000, 2010, 2020, etc.). Whether the figure is a decennial census or an intercensal estimate is noted.
National population
| Year | Total national population |
|---|---|
| 2024 (intercensual estimate)76 | 340,110,988 |
| 2023 (intercensual estimate)76 | 336,806,231 |
| 2022 (intercensual estimate)76 | 334,017,321 |
| 2021 (intercensual estimate)76 | 332,099,760 |
| 2020 (census)77 | 331,449,390 |
| 2019 (intercensal estimate)77 | 330,226,227 |
| 2018 (intercensal estimate)77 | 328,529,577 |
| 2017 (intercensal estimate)77 | 326,353,340 |
| 2016 (intercensal estimate)77 | 324,353,340 |
| 2015 (intercensal estimate)77 | 321,815,121 |
| 2014 (intercensal estimate)77 | 319,257,560 |
| 2013 (intercensal estimate)77 | 316,726,282 |
| 2012 (intercensal estimate)77 | 314,339,099 |
| 2011 (intercensal estimate)77 | 311,839,461 |
| 2010 (census)77 | 308,745,538 |
| 2009 (intercensal estimate)78 | 306,771,529 |
| 2008 (intercensal estimate)78 | 304,093,966 |
| 2007 (intercensal estimate)78 | 301,231,207 |
| 2006 (intercensal estimate)78 | 298,379,912 |
| 2005 (intercensal estimate)78 | 295,516,599 |
| 2004 (intercensal estimate)78 | 292,805,298 |
| 2003 (intercensal estimate)78 | 290,107,933 |
| 2002 (intercensal estimate)78 | 287,625,193 |
| 2001 (intercensal estimate)78 | 284,968,955 |
| 2000 (census)78 | 281,424,600 |
| 1999 (intercensal estimate)79 | 272,690,813 |
| 1998 (intercensal estimate)79 | 270,248,003 |
| 1997 (intercensal estimate)79 | 267,783,607 |
| 1996 (intercensal estimate)79 | 265,228,572 |
| 1995 (intercensal estimate)79 | 262,803,276 |
| 1994 (intercensal estimate)79 | 260,327,021 |
| 1993 (intercensal estimate)79 | 257,782,608 |
| 1992 (intercensal estimate)79 | 255,029,699 |
| 1991 (intercensal estimate)79 | 252,153,092 |
| 1990 (census)80 | 248,709,873 |
| 1989 (intercensal estimate)81 | 246,819,230 |
| 1988 (intercensal estimate)81 | 244,498,982 |
| 1987 (intercensal estimate)81 | 242,288,918 |
| 1986 (intercensal estimate)81 | 240,132,887 |
| 1985 (intercensal estimate)81 | 237,923,795 |
| 1984 (intercensal estimate)81 | 235,824,902 |
| 1983 (intercensal estimate)81 | 233,791,994 |
| 1982 (intercensal estimate)81 | 231,664,458 |
| 1981 (intercensal estimate)81 | 229,465,714 |
| 1980 (census)81 | 226,545,805 |
Vital statistics
U.S. demographic table
Sources: Population82838442, Births and Deaths85868788, TFR899091, IMR92939495
Notable events in American demographics:
- 1846–1851: Irish Immigration during the Great Famine
- 1861–1865: American Civil War
- 1874–1879: Long Depression
- 1917–1918: World War I and Spanish flu pandemic
- 1929–1939: Great Depression
- 1941–1945: World War II
- 1946–1964: mid-20th-century baby boom
- 1957–1958: Asian flu pandemic
- 2008: 2008 financial crisis and Great Recession
- 2020–2023: COVID-19 pandemic
- 2022–2024: Mexico–United States border crisis
| Year | Average population | Live births | Deaths | Natural change | Crude birth rate (per 1,000) | Crude death rate (per 1,000) | Natural change (per 1,000) | Crude migration change (per 1,000) | Total fertility rate fn 1 | Infant mortality rate |
|---|---|---|---|---|---|---|---|---|---|---|
| 1790 | 3,929,000 | |||||||||
| 1791 | 4,048,000 | |||||||||
| 1792 | 4,172,000 | |||||||||
| 1793 | 4,299,000 | |||||||||
| 1794 | 4,429,000 | |||||||||
| 1795 | 4,563,000 | |||||||||
| 1796 | 4,701,000 | |||||||||
| 1797 | 4,844,000 | |||||||||
| 1798 | 4,990,000 | |||||||||
| 1799 | 5,141,000 | |||||||||
| 1800 | 5,297,000 | 290,000 | 138,000 | 152,000 | 54.7 | 26.1 | 28.6 | 0.8 | 7.03 | |
| 1801 | 5,461,000 | 299,000 | 141,000 | 158,000 | 54.8 | 25.8 | 29.0 | 1.1 | ||
| 1802 | 5,632,000 | 308,000 | 145,000 | 163,000 | 54.7 | 25.7 | 29.0 | 1.4 | ||
| 1803 | 5,809,000 | 317,000 | 149,000 | 168,000 | 54.6 | 25.6 | 29.0 | 1.5 | ||
| 1804 | 5,991,000 | 327,000 | 153,000 | 174,000 | 54.6 | 25.5 | 29.1 | 1.3 | ||
| 1805 | 6,180,000 | 337,000 | 157,000 | 180,000 | 54.5 | 25.4 | 29.1 | 1.5 | 6.96 | |
| 1806 | 6,379,000 | 347,000 | 163,000 | 184,000 | 54.4 | 25.6 | 28.8 | 2.4 | ||
| 1807 | 6,588,000 | 358,000 | 170,000 | 188,000 | 54.3 | 25.8 | 28.5 | 3.2 | ||
| 1808 | 6,797,000 | 369,000 | 176,000 | 193,000 | 54.3 | 25.9 | 28.4 | 2.4 | ||
| 1809 | 7,009,000 | 380,000 | 183,000 | 197,000 | 54.2 | 26.1 | 28.1 | 2.1 | ||
| 1810 | 7,224,000 | 391,000 | 192,000 | 199,000 | 54.1 | 26.6 | 27.5 | 2.2 | 6.85 | |
| 1811 | 7,436,000 | 401,000 | 198,000 | 203,000 | 53.9 | 26.6 | 27.3 | 1.2 | ||
| 1812 | 7,651,000 | 411,000 | 204,000 | 207,000 | 53.7 | 26.7 | 27.0 | 1.0 | ||
| 1813 | 7,867,000 | 421,000 | 210,000 | 211,000 | 53.5 | 26.7 | 26.8 | 0.6 | ||
| 1814 | 8,085,000 | 431,000 | 216,000 | 215,000 | 53.3 | 26.7 | 26.6 | 0.4 | ||
| 1815 | 8,308,000 | 441,000 | 222,000 | 219,000 | 53.1 | 26.7 | 26.4 | 0.5 | 6.74 | |
| 1816 | 8,540,000 | 452,000 | 224,000 | 228,000 | 52.9 | 26.2 | 26.7 | 0.5 | ||
| 1817 | 8,790,000 | 463,000 | 226,000 | 237,000 | 52.7 | 25.7 | 27.0 | 1.5 | ||
| 1818 | 9,057,000 | 476,000 | 229,000 | 247,000 | 52.6 | 25.3 | 27.3 | 2.2 | ||
| 1819 | 9,335,000 | 488,000 | 233,000 | 255,000 | 52.3 | 25.0 | 27.3 | 2.5 | ||
| 1820 | 9,618,000 | 501,000 | 242,000 | 259,000 | 52.1 | 25.2 | 26.9 | 2.5 | 6.63 | |
| 1821 | 9,899,000 | 516,000 | 247,000 | 269,000 | 52.1 | 25.0 | 27.1 | 1.2 | ||
| 1822 | 10,189,000 | 532,000 | 252,000 | 280,000 | 52.2 | 24.7 | 27.5 | 1.0 | ||
| 1823 | 10,488,000 | 548,000 | 258,000 | 290,000 | 52.3 | 24.6 | 27.7 | 0.9 | ||
| 1824 | 10,795,000 | 564,000 | 263,000 | 301,000 | 52.2 | 24.4 | 27.8 | 0.6 | ||
| 1825 | 11,115,000 | 581,000 | 269,000 | 312,000 | 52.3 | 24.2 | 28.1 | 0.7 | 6.52 | |
| 1826 | 11,449,000 | 599,000 | 281,000 | 318,000 | 52.3 | 24.5 | 27.8 | 1.4 | ||
| 1827 | 11,797,000 | 618,000 | 294,000 | 324,000 | 52.4 | 24.9 | 27.5 | 2.0 | ||
| 1828 | 12,158,000 | 637,000 | 308,000 | 329,000 | 52.4 | 25.3 | 27.1 | 2.6 | ||
| 1829 | 12,525,000 | 657,000 | 322,000 | 335,000 | 52.9 | 25.7 | 26.8 | 2.6 | ||
| 1830 | 12,901,000 | 677,000 | 355,000 | 322,000 | 52.5 | 27.5 | 25.0 | 4.2 | 6.42 | |
| 1831 | 13,277,000 | 692,000 | 366,000 | 326,000 | 52.1 | 27.6 | 24.5 | 3.8 | ||
| 1832 | 13,676,000 | 708,000 | 376,000 | 332,000 | 51.8 | 27.5 | 24.3 | 4.9 | ||
| 1833 | 14,086,000 | 724,000 | 387,000 | 337,000 | 51.4 | 27.5 | 23.9 | 5.2 | ||
| 1834 | 14,504,000 | 740,000 | 398,000 | 342,000 | 51.0 | 27.4 | 23.6 | 5.2 | ||
| 1835 | 14,917,000 | 756,000 | 409,000 | 347,000 | 50.7 | 27.4 | 23.3 | 4.4 | 6.32 | |
| 1836 | 15,340,000 | 772,000 | 417,000 | 355,000 | 50.3 | 27.2 | 23.1 | 4.4 | ||
| 1837 | 15,790,000 | 789,000 | 425,000 | 364,000 | 50.0 | 26.9 | 23.1 | 5.4 | ||
| 1838 | 16,224,000 | 805,000 | 432,000 | 373,000 | 49.6 | 26.6 | 23.0 | 3.8 | ||
| 1839 | 16,656,000 | 820,000 | 440,000 | 380,000 | 49.2 | 26.4 | 22.8 | 3.1 | ||
| 1840 | 17,120,000 | 837,000 | 437,000 | 400,000 | 48.9 | 25.5 | 23.4 | 3.7 | 6.22 | |
| 1841 | 17,612,000 | 852,000 | 442,000 | 410,000 | 48.4 | 25.1 | 23.3 | 4.7 | ||
| 1842 | 18,124,000 | 867,000 | 448,000 | 419,000 | 47.8 | 24.7 | 23.1 | 5.1 | ||
| 1843 | 18,641,000 | 883,000 | 453,000 | 430,000 | 47.4 | 24.3 | 23.1 | 4.7 | ||
| 1844 | 19,157,000 | 897,000 | 458,000 | 439,000 | 46.8 | 23.9 | 22.9 | 4.0 | ||
| 1845 | 19,708,000 | 913,000 | 462,000 | 451,000 | 46.3 | 23.4 | 22.9 | 5.1 | 6.05 | |
| 1846 | 20,313,000 | 930,000 | 469,000 | 461,000 | 45.8 | 23.1 | 22.7 | 7.1 | ||
| 1847 | 20,987,000 | 950,000 | 477,000 | 473,000 | 45.3 | 22.7 | 22.6 | 9.6 | ||
| 1848 | 21,706,000 | 972,000 | 485,000 | 487,000 | 44.8 | 22.3 | 22.5 | 10.7 | ||
| 1849 | 22,464,000 | 994,000 | 494,000 | 500,000 | 44.2 | 22.0 | 22.2 | 11.5 | ||
| 1850 | 23,261,000 | 1,017,000 | 513,000 | 504,000 | 43.7 | 22.1 | 21.6 | 12.6 | 5.82 | |
| 1851 | 24,095,000 | 1,050,000 | 532,000 | 518,000 | 43.6 | 22.1 | 21.5 | 13.1 | ||
| 1852 | 24,999,000 | 1,086,000 | 553,000 | 533,000 | 43.4 | 22.1 | 21.3 | 14.8 | ||
| 1853 | 25,911,000 | 1,122,000 | 574,000 | 548,000 | 43.3 | 22.2 | 21.1 | 14.0 | ||
| 1854 | 26,856,000 | 1,160,000 | 597,000 | 563,000 | 43.2 | 22.2 | 21.0 | 14.2 | ||
| 1855 | 27,727,000 | 1,193,000 | 618,000 | 575,000 | 43.0 | 22.3 | 20.7 | 10.7 | 5.60 | |
| 1856 | 28,497,000 | 1,223,000 | 640,000 | 583,000 | 42.9 | 22.5 | 20.4 | 6.6 | ||
| 1857 | 29,298,000 | 1,253,000 | 664,000 | 589,000 | 42.8 | 22.7 | 20.1 | 7.2 | ||
| 1858 | 30,068,000 | 1,282,000 | 688,000 | 594,000 | 42.6 | 22.9 | 19.7 | 5.9 | ||
| 1859 | 30,780,000 | 1,308,000 | 710,000 | 598,000 | 42.5 | 23.1 | 19.4 | 3.7 | ||
| 1860 | 31,513,000 | 1,335,000 | 756,000 | 579,000 | 42.4 | 24.0 | 18.4 | 4.9 | 5.37 | |
| 1861 | 32,215,000 | 1,362,000 | 779,000 | 583,000 | 42.3 | 24.2 | 18.1 | 3.7 | ||
| 1862 | 32,889,000 | 1,388,000 | 805,000 | 583,000 | 42.2 | 24.5 | 17.7 | 2.8 | ||
| 1863 | 33,607,000 | 1,415,000 | 831,000 | 584,000 | 42.1 | 24.7 | 17.4 | 4.0 | ||
| 1864 | 34,376,000 | 1,445,000 | 859,000 | 586,000 | 42.0 | 25.0 | 17.0 | 5.3 | ||
| 1865 | 35,182,000 | 1,476,000 | 889,000 | 587,000 | 42.0 | 25.3 | 16.7 | 6.2 | 5.20 | |
| 1866 | 36,052,000 | 1,510,000 | 909,000 | 601,000 | 41.9 | 25.2 | 16.7 | 7.5 | ||
| 1867 | 36,970,000 | 1,545,000 | 928,000 | 617,000 | 41.8 | 25.1 | 16.7 | 8.1 | ||
| 1868 | 37,885,000 | 1,581,000 | 948,000 | 633,000 | 41.7 | 25.0 | 16.7 | 7.4 | ||
| 1869 | 38,870,000 | 1,619,000 | 970,000 | 649,000 | 41.7 | 25.0 | 16.7 | 8.6 | ||
| 1870 | 39,905,000 | 1,658,000 | 920,000 | 738,000 | 41.5 | 23.1 | 18.4 | 7.4 | 5.07 | |
| 1871 | 41,010,000 | 1,701,000 | 945,000 | 756,000 | 41.5 | 23.0 | 18.5 | 8.5 | ||
| 1872 | 42,066,000 | 1,742,000 | 962,000 | 780,000 | 41.4 | 22.9 | 18.5 | 6.6 | ||
| 1873 | 43,225,000 | 1,786,000 | 984,000 | 802,000 | 41.3 | 22.8 | 18.5 | 8.3 | ||
| 1874 | 44,429,000 | 1,832,000 | 1,014,000 | 818,000 | 41.2 | 22.8 | 18.4 | 8.7 | ||
| 1875 | 45,492,000 | 1,872,000 | 1,076,000 | 796,000 | 41.2 | 23.7 | 17.5 | 5.9 | 4.94 | |
| 1876 | 46,459,000 | 1,893,000 | 1,088,000 | 805,000 | 40.7 | 23.4 | 17.3 | 3.5 | ||
| 1877 | 47,400,000 | 1,912,000 | 1,099,000 | 813,000 | 40.3 | 23.2 | 17.1 | 2.7 | ||
| 1878 | 48,319,000 | 1,929,000 | 1,110,000 | 819,000 | 39.9 | 23.0 | 16.9 | 2.1 | ||
| 1879 | 49,264,000 | 1,946,000 | 1,120,000 | 826,000 | 39.5 | 22.7 | 16.8 | 2.4 | ||
| 1880 | 50,262,000 | 1,965,000 | 1,131,000 | 834,000 | 39.1 | 22.5 | 16.6 | 3.3 | 4.80 | |
| 1881 | 51,466,000 | 1,991,000 | 1,146,000 | 845,000 | 38.7 | 22.3 | 16.4 | 7.0 | ||
| 1882 | 52,893,000 | 2,024,000 | 1,166,000 | 858,000 | 38.3 | 22.0 | 16.3 | 10.8 | ||
| 1883 | 54,435,000 | 2,061,000 | 1,187,000 | 874,000 | 37.9 | 21.8 | 16.1 | 12.3 | ||
| 1884 | 55,826,000 | 2,090,000 | 1,204,000 | 886,000 | 37.4 | 21.6 | 15.8 | 9.0 | ||
| 1885 | 57,128,000 | 2,115,000 | 1,219,000 | 896,000 | 37.0 | 21.3 | 15.7 | 7.1 | 4.61 | |
| 1886 | 58,258,000 | 2,129,000 | 1,232,000 | 897,000 | 36.5 | 21.1 | 15.4 | 4.0 | ||
| 1887 | 59,357,000 | 2,141,000 | 1,244,000 | 897,000 | 36.1 | 21.0 | 15.1 | 3.4 | ||
| 1888 | 60,614,000 | 2,157,000 | 1,259,000 | 898,000 | 35.6 | 20.8 | 14.8 | 5.9 | ||
| 1889 | 61,893,000 | 2,173,000 | 1,274,000 | 899,000 | 35.1 | 20.6 | 14.5 | 6.1 | ||
| 1890 | 63,056,000 | 2,183,000 | 1,286,000 | 897,000 | 34.6 | 20.4 | 14.2 | 4.2 | 4.39 | |
| 1891 | 64,432,000 | 2,200,000 | 1,302,000 | 898,000 | 34.1 | 20.2 | 13.9 | 7.4 | ||
| 1892 | 65,920,000 | 2,219,000 | 1,319,000 | 900,000 | 33.7 | 20.0 | 13.7 | 8.9 | ||
| 1893 | 67,470,000 | 2,239,000 | 1,337,000 | 902,000 | 33.2 | 19.8 | 13.4 | 9.6 | ||
| 1894 | 68,910,000 | 2,253,000 | 1,353,000 | 900,000 | 32.7 | 19.6 | 13.1 | 7.8 | ||
| 1895 | 70,076,000 | 2,258,000 | 1,362,000 | 896,000 | 32.2 | 19.4 | 12.8 | 3.9 | 4.17 | |
| 1896 | 71,188,000 | 2,279,000 | 1,368,000 | 911,000 | 32.0 | 19.2 | 12.8 | 2.8 | ||
| 1897 | 72,441,000 | 2,303,000 | 1,377,000 | 926,000 | 31.8 | 19.0 | 12.8 | 4.5 | ||
| 1898 | 73,600,000 | 2,325,000 | 1,383,000 | 942,000 | 31.6 | 18.8 | 12.8 | 2.9 | ||
| 1899 | 74,793,000 | 2,346,000 | 1,389,000 | 957,000 | 31.4 | 18.6 | 12.8 | 3.2 | ||
| 1900 | 76,094,000 | 2,371,000 | 1,308,000 | 1,063,000 | 31.2 | 17.2 | 14.0 | 3.1 | 3.94 | |
| 1901 | 77,584,000 | 2,401,000 | 1,274,000 | 1,127,000 | 30.9 | 16.4 | 14.5 | 4.7 | ||
| 1902 | 79,163,000 | 2,433,000 | 1,225,000 | 1,208,000 | 30.7 | 15.5 | 15.2 | 4.7 | ||
| 1903 | 80,632,000 | 2,461,000 | 1,260,000 | 1,201,000 | 30.5 | 15.6 | 14.9 | 3.3 | ||
| 1904 | 82,166,000 | 2,491,000 | 1,348,000 | 1,143,000 | 30.3 | 16.4 | 13.9 | 4.8 | ||
| 1905 | 83,822,000 | 2,523,000 | 1,332,000 | 1,191,000 | 30.1 | 15.9 | 14.2 | 5.9 | 3.81 | |
| 1906 | 85,450,000 | 2,547,000 | 1,343,000 | 1,204,000 | 29.8 | 15.7 | 14.1 | 5.0 | ||
| 1907 | 87,008,000 | 2,568,000 | 1,385,000 | 1,183,000 | 29.5 | 15.9 | 13.6 | 4.3 | ||
| 1908 | 88,710,000 | 2,592,000 | 1,302,000 | 1,290,000 | 29.2 | 14.7 | 14.5 | 4.6 | ||
| 1909 | 90,490,000 | 2,718,000 | 1,289,000 | 1,429,000 | 30.0 | 14.2 | 15.8 | 3.9 | ||
| 1910 | 92,407,000 | 2,777,000 | 1,357,000 | 1,420,000 | 30.1 | 14.7 | 15.4 | 5.4 | 3.64 | |
| 1911 | 93,863,000 | 2,809,000 | 1,305,000 | 1,504,000 | 29.9 | 13.9 | 16.0 | -0.5 | 3.57 | 114.0 |
| 1912 | 95,335,000 | 2,840,000 | 1,297,000 | 1,543,000 | 29.8 | 13.6 | 16.2 | -0.7 | 3.56 | 111.1 |
| 1913 | 97,225,000 | 2,869,000 | 1,343,000 | 1,526,000 | 29.5 | 13.8 | 15.7 | 3.7 | 3.45 | 114.8 |
| 1914 | 99,111,000 | 2,966,000 | 1,318,000 | 1,648,000 | 29.9 | 13.3 | 16.6 | 2.4 | 3.57 | 107.2 |
| 1915 | 100,546,000 | 2,965,000 | 1,325,000 | 1,640,000 | 29.5 | 13.2 | 16.3 | -2.0 | 3.52 | 99.9 |
| 1916 | 101,961,000 | 2,964,000 | 1,408,000 | 1,556,000 | 29.1 | 13.8 | 15.3 | -1.4 | 3.47 | 101.0 |
| 1917 | 103,414,000 | 2,944,000 | 1,445,000 | 1,499,000 | 28.5 | 14.0 | 14.5 | -0.4 | 3.333 | 93.8 |
| 1918 | 104,550,000 | 2,948,000 | 1,892,000 | 1,056,000 | 28.2 | 18.1 | 10.1 | 0.8 | 3.312 | 100.9 |
| 1919 | 105,063,000 | 2,740,000 | 1,354,000 | 1,386,000 | 26.1 | 12.9 | 13.2 | -8.3 | 3.068 | 86.6 |
| 1920 | 106,461,000 | 2,950,000 | 1,383,000 | 1,567,000 | 27.7 | 13.0 | 14.7 | -1.6 | 3.263 | 85.8 |
| 1921 | 108,538,000 | 3,055,000 | 1,248,000 | 1,807,000 | 28.1 | 11.5 | 16.6 | 2.5 | 3.326 | 75.6 |
| 1922 | 110,049,000 | 2,882,000 | 1,286,000 | 1,596,000 | 26.2 | 11.7 | 14.5 | -0.8 | 3.109 | 76.2 |
| 1923 | 111,947,000 | 2,910,000 | 1,358,000 | 1,552,000 | 26.0 | 12.1 | 13.9 | 3.1 | 3.101 | 77.1 |
| 1924 | 114,109,000 | 2,979,000 | 1,323,000 | 1,656,000 | 26.1 | 11.6 | 14.5 | 4.4 | 3.121 | 70.8 |
| 1925 | 115,828,000 | 2,909,000 | 1,353,000 | 1,556,000 | 25.1 | 11.7 | 13.4 | 1.4 | 3.012 | 71.7 |
| 1926 | 117,397,000 | 2,839,000 | 1,422,000 | 1,417,000 | 24.2 | 12.1 | 12.1 | 1.3 | 2.901 | 73.3 |
| 1927 | 119,085,000 | 2,802,000 | 1,347,000 | 1,455,000 | 23.5 | 11.3 | 12.2 | 2.0 | 2.824 | 64.6 |
| 1928 | 120,509,000 | 2,674,000 | 1,445,000 | 1,229,000 | 22.2 | 12.0 | 10.2 | 1.6 | 2.660 | 68.7 |
| 1929 | 121,767,000 | 2,582,000 | 1,447,000 | 1,135,000 | 21.2 | 11.9 | 9.3 | 1.0 | 2.532 | 67.6 |
| 1930 | 123,076,741 | 2,618,000 | 1,393,000 | 1,225,000 | 21.3 | 11.3 | 10.0 | 0.7 | 2.533 | 64.6 |
| 1931 | 124,039,648 | 2,506,000 | 1,372,000 | 1,134,000 | 20.2 | 11.1 | 9.1 | -1.4 | 2.402 | 61.6 |
| 1932 | 124,840,471 | 2,440,000 | 1,358,000 | 1,082,000 | 19.5 | 10.9 | 8.7 | -2.3 | 2.319 | 57.6 |
| 1933 | 125,578,763 | 2,307,000 | 1,342,106 | 964,894 | 18.4 | 10.7 | 7.7 | -1.8 | 2.172 | 58.1 |
| 1934 | 126,373,773 | 2,396,000 | 1,396,903 | 999,097 | 19.0 | 11.1 | 7.9 | -1.6 | 2.232 | 60.1 |
| 1935 | 127,250,232 | 2,377,000 | 1,392,752 | 984,248 | 18.7 | 10.9 | 7.7 | -0.8 | 2.189 | 55.7 |
| 1936 | 128,053,180 | 2,355,000 | 1,479,228 | 875,772 | 18.4 | 11.6 | 6.8 | -0.6 | 2.146 | 57.1 |
| 1937 | 128,824,829 | 2,413,000 | 1,450,427 | 962,573 | 18.7 | 11.3 | 7.5 | -1.5 | 2.173 | 54.4 |
| 1938 | 129,824,939 | 2,496,000 | 1,381,391 | 1,114,609 | 19.2 | 10.6 | 8.6 | -0.9 | 2.222 | 51.0 |
| 1939 | 130,879,718 | 2,466,000 | 1,387,897 | 1,078,103 | 18.8 | 10.6 | 8.2 | -0.2 | 2.172 | 48.0 |
| 1940 | 132,122,446 | 2,559,000 | 1,417,269 | 1,141,731 | 19.4 | 10.7 | 8.6 | 0.8 | 2.301 | 47.0 |
| 1941 | 133,402,471 | 2,703,000 | 1,397,642 | 1,305,358 | 20.3 | 10.5 | 9.8 | -0.2 | 2.399 | 45.3 |
| 1942 | 134,859,553 | 2,989,000 | 1,385,187 | 1,603,813 | 22.2 | 10.3 | 11.9 | -1.1 | 2.628 | 40.4 |
| 1943 | 136,739,353 | 3,104,000 | 1,459,544 | 1,644,456 | 22.7 | 10.7 | 12.0 | 1.7 | 2.718 | 40.4 |
| 1944 | 138,397,345 | 2,939,000 | 1,411,338 | 1,527,662 | 21.2 | 10.2 | 11.0 | 0.9 | 2.568 | 39.8 |
| 1945 | 139,928,165 | 2,858,000 | 1,401,719 | 1,456,281 | 20.4 | 10.0 | 10.4 | 0.5 | 2.491 | 38.3 |
| 1946 | 141,388,566 | 3,411,000 | 1,395,617 | 2,015,383 | 24.1 | 9.9 | 14.3 | -3.9 | 2.943 | 33.8 |
| 1947 | 144,126,071 | 3,817,000 | 1,445,370 | 2,371,630 | 26.5 | 10.0 | 16.5 | 2.5 | 3.274 | 32.2 |
| 1948 | 146,631,302 | 3,637,000 | 1,444,337 | 2,192,663 | 24.8 | 9.9 | 15.0 | 2.1 | 3.109 | 32.0 |
| 1949 | 149,188,130 | 3,649,000 | 1,443,607 | 2,205,393 | 24.5 | 9.7 | 14.8 | 2.4 | 3.110 | 31.3 |
| 1950 | 152,271,417 | 3,632,000 | 1,452,454 | 2,179,546 | 23.9 | 9.5 | 14.3 | 5.9 | 3.091 | 29.2 |
| 1951 | 154,877,889 | 3,823,000 | 1,482,099 | 2,340,901 | 24.7 | 9.6 | 15.1 | 1.7 | 3.269 | 28.4 |
| 1952 | 157,552,740 | 3,913,000 | 1,496,838 | 2,416,162 | 24.8 | 9.5 | 15.3 | 1.6 | 3.358 | 28.4 |
| 1953 | 160,184,192 | 3,965,000 | 1,518,459 | 2,446,541 | 24.8 | 9.5 | 15.3 | 1.2 | 3.424 | 27.8 |
| 1954 | 163,025,854 | 4,078,000 | 1,481,091 | 2,596,909 | 25.0 | 9.1 | 15.9 | 1.5 | 3.543 | 26.6 |
| 1955 | 165,931,202 | 4,104,000 | 1,528,717 | 2,575,283 | 24.7 | 9.2 | 15.5 | 2.0 | 3.580 | 26.4 |
| 1956 | 168,903,031 | 4,218,000 | 1,564,476 | 2,653,524 | 25.0 | 9.3 | 15.7 | 1.9 | 3.689 | 26.0 |
| 1957 | 171,984,130 | 4,308,000 | 1,633,128 | 2,674,872 | 25.0 | 9.5 | 15.6 | 2.4 | 3.767 | 26.3 |
| 1958 | 174,881,904 | 4,255,000 | 1,647,886 | 2,607,114 | 24.3 | 9.4 | 14.9 | 1.7 | 3.701 | 27.1 |
| 1959 | 177,829,628 | 4,244,796 | 1,656,814 | 2,587,982 | 23.9 | 9.3 | 14.6 | 2.0 | 3.670 | 26.4 |
| 1960 | 180,671,158 | 4,257,850 | 1,711,982 | 2,545,868 | 23.6 | 9.5 | 14.1 | 1.6 | 3.654 | 26.0 |
| 1961 | 183,691,481 | 4,268,326 | 1,701,522 | 2,566,804 | 23.2 | 9.3 | 14.0 | 2.5 | 3.629 | 25.3 |
| 1962 | 186,537,737 | 4,167,362 | 1,756,720 | 2,410,642 | 22.3 | 9.4 | 12.9 | 2.3 | 3.474 | 25.3 |
| 1963 | 189,241,798 | 4,098,020 | 1,813,549 | 2,284,471 | 21.7 | 9.6 | 12.1 | 2.2 | 3.333 | 25.2 |
| 1964 | 191,888,791 | 4,027,490 | 1,798,051 | 2,229,439 | 21.0 | 9.4 | 11.6 | 2.2 | 3.208 | 24.8 |
| 1965 | 194,302,963 | 3,760,358 | 1,828,136 | 1,932,222 | 19.4 | 9.4 | 9.9 | 2.5 | 2.928 | 24.7 |
| 1966 | 196,560,338 | 3,606,274 | 1,863,149 | 1,743,125 | 18.3 | 9.5 | 8.9 | 2.6 | 2.736 | 23.7 |
| 1967 | 198,712,056 | 3,520,959 | 1,851,323 | 1,669,636 | 17.7 | 9.3 | 8.4 | 2.4 | 2.578 | 22.4 |
| 1968 | 200,706,052 | 3,501,564 | 1,930,082 | 1,571,482 | 17.4 | 9.6 | 7.8 | 2.1 | 2.477 | 21.8 |
| 1969 | 202,676,946 | 3,600,206 | 1,921,990 | 1,678,216 | 17.8 | 9.5 | 8.3 | 1.4 | 2.465 | 20.9 |
| 1970 | 205,052,174 | 3,731,386 | 1,921,031 | 1,810,355 | 18.2 | 9.4 | 8.8 | 2.8 | 2.480 | 20.0 |
| 1971 | 207,660,677 | 3,555,970 | 1,927,542 | 1,628,428 | 17.1 | 9.3 | 7.8 | 4.7 | 2.266 | 19.1 |
| 1972 | 209,896,021 | 3,258,411 | 1,963,944 | 1,294,467 | 15.5 | 9.4 | 6.2 | 4.5 | 2.010 | 18.5 |
| 1973 | 211,908,788 | 3,136,965 | 1,973,003 | 1,163,962 | 14.8 | 9.3 | 5.5 | 4.0 | 1.879 | 17.7 |
| 1974 | 213,853,928 | 3,159,958 | 1,934,388 | 1,225,570 | 14.8 | 9.0 | 5.7 | 3.4 | 1.835 | 16.7 |
| 1975 | 215,973,199 | 3,144,198 | 1,892,879 | 1,251,319 | 14.6 | 8.8 | 5.8 | 4.0 | 1.774 | 16.1 |
| 1976 | 218,035,164 | 3,167,788 | 1,909,440 | 1,258,348 | 14.5 | 8.8 | 5.8 | 3.7 | 1.738 | 15.2 |
| 1977 | 220,239,425 | 3,326,632 | 1,899,597 | 1,427,035 | 15.1 | 8.6 | 6.5 | 3.5 | 1.789 | 14.1 |
| 1978 | 222,584,545 | 3,333,279 | 1,927,788 | 1,405,491 | 15.0 | 8.7 | 6.3 | 4.2 | 1.760 | 13.8 |
| 1979 | 225,055,487 | 3,494,398 | 1,913,841 | 1,580,557 | 15.5 | 8.5 | 7.0 | 4.0 | 1.808 | 13.1 |
| 1980 | 227,224,681 | 3,612,258 | 1,989,841 | 1,622,417 | 15.9 | 8.8 | 7.1 | 2.4 | 1.839 | 12.6 |
| 1981 | 229,465,714 | 3,629,238 | 1,977,981 | 1,651,257 | 15.8 | 8.6 | 7.2 | 2.6 | 1.812 | 11.9 |
| 1982 | 231,664,458 | 3,680,537 | 1,974,797 | 1,705,740 | 15.9 | 8.5 | 7.4 | 2.1 | 1.827 | 11.5 |
| 1983 | 233,791,994 | 3,638,933 | 2,019,201 | 1,619,732 | 15.6 | 8.6 | 6.9 | 2.2 | 1.799 | 11.2 |
| 1984 | 235,824,902 | 3,669,141 | 2,039,369 | 1,629,772 | 15.6 | 8.6 | 6.9 | 1.7 | 1.806 | 10.8 |
| 1985 | 237,923,795 | 3,760,561 | 2,086,440 | 1,674,121 | 15.8 | 8.8 | 7.0 | 1.8 | 1.844 | 10.6 |
| 1986 | 240,132,887 | 3,756,547 | 2,105,361 | 1,651,186 | 15.6 | 8.8 | 6.9 | 2.3 | 1.837 | 10.4 |
| 1987 | 242,288,918 | 3,809,394 | 2,123,323 | 1,686,071 | 15.7 | 8.8 | 7.0 | 1.9 | 1.872 | 10.1 |
| 1988 | 244,498,982 | 3,909,510 | 2,167,999 | 1,741,511 | 16.0 | 8.9 | 7.1 | 1.9 | 1.934 | 10.0 |
| 1989 | 246,819,230 | 4,040,958 | 2,150,466 | 1,890,492 | 16.4 | 8.7 | 7.7 | 1.7 | 2.014 | 9.8 |
| 1990 | 249,622,814 | 4,158,212 | 2,148,463 | 2,009,749 | 16.7 | 8.6 | 8.1 | 3.2 | 2.081 | 9.2 |
| 1991 | 252,980,021 | 4,110,907 | 2,169,518 | 1,941,389 | 16.2 | 8.6 | 7.7 | 5.6 | 2.062 | 8.9 |
| 1992 | 256,512,810 | 4,065,014 | 2,175,613 | 1,889,401 | 15.8 | 8.5 | 7.4 | 6.4 | 2.046 | 8.4 |
| 1993 | 259,921,907 | 4,000,240 | 2,268,553 | 1,731,687 | 15.4 | 8.7 | 6.7 | 6.5 | 2.019 | 8.4 |
| 1994 | 263,126,536 | 3,952,767 | 2,278,994 | 1,673,773 | 15.0 | 8.7 | 6.4 | 5.8 | 2.001 | 8.0 |
| 1995 | 266,278,403 | 3,899,589 | 2,312,132 | 1,587,457 | 14.6 | 8.7 | 6.0 | 5.9 | 1.978 | 7.6 |
| 1996 | 269,394,284 | 3,891,494 | 2,314,690 | 1,576,804 | 14.4 | 8.6 | 5.9 | 5.7 | 1.976 | 7.3 |
| 1997 | 272,646,074 | 3,880,894 | 2,314,245 | 1,566,649 | 14.2 | 8.5 | 5.7 | 6.2 | 1.971 | 7.2 |
| 1998 | 275,854,104 | 3,941,553 | 2,337,256 | 1,604,297 | 14.3 | 8.5 | 5.8 | 5.8 | 1.999 | 7.2 |
| 1999 | 279,040,168 | 3,959,417 | 2,391,399 | 1,568,018 | 14.2 | 8.6 | 5.6 | 5.8 | 2.007 | 7.0 |
| 2000 | 282,162,411 | 4,058,814 | 2,403,351 | 1,655,463 | 14.4 | 8.5 | 5.9 | 5.2 | 2.056 | 6.9 |
| 2001 | 284,968,955 | 4,025,933 | 2,416,425 | 1,609,508 | 14.1 | 8.5 | 5.6 | 4.2 | 2.030 | 6.8 |
| 2002 | 287,625,193 | 4,021,726 | 2,443,387 | 1,578,339 | 14.0 | 8.5 | 5.5 | 3.7 | 2.020 | 7.0 |
| 2003 | 290,107,933 | 4,089,950 | 2,448,288 | 1,641,662 | 14.1 | 8.4 | 5.7 | 2.9 | 2.047 | 6.8 |
| 2004 | 292,805,298 | 4,112,052 | 2,397,615 | 1,714,437 | 14.0 | 8.2 | 5.9 | 3.4 | 2.051 | 6.8 |
| 2005 | 295,516,599 | 4,138,349 | 2,448,017 | 1,690,332 | 14.0 | 8.3 | 5.7 | 3.5 | 2.057 | 6.9 |
| 2006 | 298,379,912 | 4,265,555 | 2,426,264 | 1,839,291 | 14.3 | 8.1 | 6.2 | 3.4 | 2.108 | 6.7 |
| 2007 | 301,231,207 | 4,316,234 | 2,423,712 | 1,892,522 | 14.3 | 8.0 | 6.3 | 3.2 | 2.120 | 6.8 |
| 2008 | 304,093,966 | 4,247,694 | 2,471,984 | 1,775,710 | 14.0 | 8.1 | 5.8 | 3.6 | 2.072 | 6.6 |
| 2009 | 306,771,529 | 4,130,665 | 2,437,163 | 1,693,502 | 13.5 | 7.9 | 5.5 | 3.2 | 2.002 | 6.4 |
| 2010 | 309,327,143 | 3,999,386 | 2,468,435 | 1,530,951 | 12.9 | 8.0 | 4.9 | 3.3 | 1.931 | 6.1 |
| 2011 | 311,849,745 | 3,953,590 | 2,515,458 | 1,438,132 | 12.7 | 8.1 | 4.6 | 3.5 | 1.894 | 6.1 |
| 2012 | 314,361,094 | 3,952,841 | 2,543,279 | 1,409,562 | 12.6 | 8.1 | 4.5 | 3.5 | 1.880 | 6.0 |
| 2013 | 316,755,680 | 3,932,181 | 2,596,993 | 1,335,188 | 12.4 | 8.2 | 4.2 | 3.3 | 1.857 | 6.0 |
| 2014 | 319,297,805 | 3,988,076 | 2,626,418 | 1,361,658 | 12.5 | 8.2 | 4.3 | 3.7 | 1.862 | 5.8 |
| 2015 | 321,882,469 | 3,978,497 | 2,712,630 | 1,265,867 | 12.4 | 8.4 | 3.9 | 4.1 | 1.843 | 5.9 |
| 2016 | 324,426,311 | 3,945,875 | 2,744,248 | 1,201,627 | 12.2 | 8.5 | 3.7 | 4.1 | 1.820 | 5.9 |
| 2017 | 326,686,918 | 3,855,500 | 2,813,503 | 1,041,997 | 11.8 | 8.6 | 3.2 | 3.7 | 1.765 | 5.8 |
| 2018 | 328,571,142 | 3,791,712 | 2,839,205 | 952,507 | 11.5 | 8.6 | 2.9 | 2.8 | 1.729 | 5.7 |
| 2019 | 330,284,261 | 3,747,540 | 2,854,858 | 892,682 | 11.3 | 8.6 | 2.7 | 2.5 | 1.706 | 5.6 |
| 2020969798 | 331,578,104 | 3,613,647 | 3,383,729 | 229,918 | 10.9 | 10.2 | 0.7 | 3.2 | 1.641 | 5.4 |
| 202199100101 | 332,100,166 | 3,664,292 | 3,464,231 | 200,061 | 11.0 | 10.4 | 0.6 | 1.0 | 1.664101 | 5.4 |
| 2022102103101 | 333,996,304 | 3,667,758 | 3,279,857 | 387,901 | 11.0 | 9.8 | 1.2 | 4.5 | 1.656101 | 5.6 |
| 2023104 | 336,755,052 | 3,596,017 | 3,090,964 | 505,053 | 10.7 | 9.2 | 1.5 | 6.7 | 1.621 | 5.6 |
| 2024105106 | 340,003,797 | 3,628,934 | 3,072,666 | 556,268 | 10.7 | 9.0 | 1.7 | 7.9 | 1.599 | 5.5 |
| 2025pa107 | 341,784,857 | 3,606,407 | 3,095,039 | 511,368 | 10.6 | 9.1 | 1.5 | 3.7 | 1.583 | 1085.4 |
- Provisional data for 2025 (especially for the last few months of the year) are subject to additional revisions in 2026 because of the underreporting of birth and death certificates.
Current vital statistics
| Period | Live births | Deaths | Natural increase |
|---|---|---|---|
| January-April 2025 | 1,165,842 | 1,094,999 | +70,843 |
| January-April 2026 | 1,139,971 | 1,036,857 | +103,114 |
| Difference | |||
| Source:109 | |||
View source data.
View source data.
View source data.
View source data.
View source data.
View source data.
View source data.
View source data.
According to the U.S. Census Bureau, in 2021, the population of the United States grew at a slower rate than in any other year since the country's founding.110 The U.S. population grew only 0.1% from the previous year before.110 The U.S. population has grown by less than one million people for the first time since 1937, with the lowest numeric growth since at least 1900, when the Census Bureau began yearly population estimates.110 Apart from the previous few years, when population growth plummeted to historically low levels, the slowest pace of increase in the twentieth century occurred between 1918 and 1919, when the influenza epidemic and World War I were both in full swing.110 Slower population growth has been the norm in the United States for some years, owing to lower fertility and net international migration, as well as rising mortality from an aging population.110
To put it another way, since the mid-2010s, births and net international migration have been dropping while deaths have risen. These trends have a cumulative effect of reduced population increase.110
The COVID-19 pandemic has accelerated this trend, resulting in a historically slow population increase in 2021.
The growth rate is 0.1% as estimated for 2021.110
The birth rate is 11.0 births/1,000 population, as of 2020.111 This was the lowest birth rate since records began. There were 3,613,647 births in 2020, this was the lowest number of births since 1980.111
- 11.0 births/1,000 population per year (final data for 2020).
- 11.4 births/1,000 population per year (final data for 2019).111
In 2020, the CDC reported that there were 1,676,911 marriages in 2020, compared to 2019, there were 2,015,603 marriages.112 Marriage rates varied significantly by state, ranging from 3.2 marriages/1,000 population in California to 21.0 marriages/1,000 population in Nevada.*113
- 5.1 marriages/1,000 population per year (provisional data for 2020).112
- 6.1 marriages/1,000 population per year (provisional data for 2019).112
*Rates are based on provisional counts of marriages by state of occurrence
In 2009, Time magazine reported that 40% of births in the United States were to unmarried women.114 The following is a breakdown by race for unwed births: 17% Asian, 29% White, 53% Hispanics (of any race), 66% Native Americans, and 72% Black American.115
According to the CDC, in 2020, there were at least 1,461,121 births to unmarried women, or 40.5% of all births in the United States. The following is a breakdown by race for unwed births: 28.4% Non-Hispanic White, 70.4% Non-Hispanic Black, and 52.8% Hispanic (of any race).116
The drop in the U.S. birth rate from 2007 to 2009 is believed to be associated with the Great Recession.117
A study by the Agency for Healthcare Research and Quality (AHRQ) found that more than half (51 percent) of live hospital births in 2008 and 2011 were male.118
Per U.S. federal government data released in March 2011, births fell 4% from 2007 to 2009, the largest drop in the U.S. for any two-year period since the 1970s.119 Births have declined for three consecutive years, and are now 7% below the peak in 2007.120 This drop has continued through 2010, according to data released by the U.S. National Center for Health Statistics in June 2011.120 Numerous experts have suggested that this decline is largely a reflection of unfavorable economic conditions.121 This connection between birth rates and economic downturns partly stems from the fact that American birth rates have now fallen to levels that are comparable to the Great Depression of the 1930s.122 Teen birth rates in the U.S. are at their lowest level in U.S. history.123 In fact, teen birth rates in the U.S. have consistently decreased since 1991 through 2011, except for a brief increase between 2005 and 2007.123 The other aberration from this otherwise steady decline in teen birth rates is the 6% decrease in birth rates for 15- to 19-year-olds between 2008 and 2009.123 Despite these years of decrease, U.S. teen birth rates still remain higher than in other developed nations.123 Racial differences prevail with teen birth and pregnancy rates as well. American Indian/Alaska Native, Hispanic, and non-Hispanic Black teen pregnancy rates are more than double the non-Hispanic white teen birth rate.124
| Age group (2010) | Total (of population) |
White alone (of race/age group) |
Black alone (of race/age group) |
Mixed and/or Some Other Race (of race/age group) |
Asian alone (of race/age group) |
Either American Indian or Alaska Native (of race/age group) |
Either Native Hawaiian or Other Pacific Islander (of race/age group) |
|---|---|---|---|---|---|---|---|
| Total | 308745538 (100%) |
223553265 (72.4%) |
38929319 (12.6%) |
28116441 (9.1%) |
14674252 (4.9%) |
2932248 (1.0%) |
540013 (0.2%) |
| 0–4 | 20201362 (6.5%) |
12795675 (5.7%/63.3%) |
2902590 (7.5%/14.4%) |
3315480 (11.8%/16.4%) |
898011 (6.1%/4.5%) |
244615 (8.3%/1.2%) |
44991 (8.3%/0.2%) |
| 5–9 | 20348657 (6.6%) |
13293799 (5.9%/65.3%) |
2882597 (7.4%/14.2%) |
2957487 (10.5%/14.5%) |
928248 (6.3%/4.6%) |
243259 (8.3%/1.2%) |
43267 (8.0%/0.0%) |
| 10–14 | 20677194 (6.7%) |
13737332 (6.1%/66.4%) |
3034266 (7.8%/14.7%) |
2736570 (9.7%/13.2%) |
881590 (6.0%/4.3%) |
245049 (8.4%/1.19%) |
42387 (7.8%/0.2%) |
| 15–19 | 22040343 (7.1%) |
14620638 (6.5%/66.4%) |
3448051 (8.9%/15.6%) |
2704571 (9.6%/12.3%) |
956028 (6.5%/4.3%) |
263805 (9.0%/1.2%) |
47250 (8.7%/0.2%) |
| 20–24 | 21585999 (7.0%) |
14535947 (6.5%/67.3%) |
3111397 (8.0%/14.4%) |
2538967 (9.0%/11.8%) |
1106222 (7.5%/5.1%) |
240716 (8.2%/1.1%) |
52750 (9.8%/0.2%) |
| 25–29 | 21101849 (6.8%) |
14345364 (6.4%/68.0%) |
2786254 (7.2%/13.2%) |
2464343 (8.8%/11.7%) |
1234322 (8.4%/5.9%) |
221654 (7.6%/1.1%) |
49912 (9.2%/0.2%) |
| 30–34 | 19962099 (6.5%) |
13573270 (6.1%/68.0%) |
2627925 (6.8%/13.2%) |
2273322 (8.1%/11.4%) |
1240906 (8.5%/6.2%) |
202928 (6.9%/1.0%) |
43748 (8.1%/0.2%) |
| 35–39 | 20179642 (6.5%) |
13996797 (6.3%/69.36%) |
2613389 (6.7%/13.0%) |
2038408 (7.2%/10.1%) |
1296301 (8.8%/6.4%) |
196017 (6.7%/1.0%) |
38730 (7.2%/0.2%) |
| 40–44 | 20890964 (6.8%) |
15052798 (6.7%/72.1%) |
2669034 (6.9%/12.8%) |
1782463 (6.3%/8.5%) |
1155565 (7.9%/5.5%) |
194713 (6.6%/0.9%) |
36391 (6.7%/0.2%) |
| 45–49 | 22708591 (7.4%) |
17028255 (7.6%/75.0%) |
2828657 (7.3%/12.5%) |
1532117 (5.4%/6.8%) |
1076060 (7.3%/4.7%) |
207857 (7.1%/0.9%) |
35645 (6.6%/0.2%) |
| 50–54 | 22298125 (7.2%) |
17178632 (7.7%/77.0%) |
2694247 (6.9%/12.1%) |
1222175 (4.3%/5.5%) |
980282 (6.7%/4.4%) |
191893 (6.5%/0.9%) |
30896 (5.7%/0.1%) |
| 55–59 | 19664805 (6.4%) |
15562187 (7.0%/79.1%) |
2205820 (5.7%/11.2%) |
873943 (3.1%/4.4%) |
844490 (5.8%/4.3%) |
154320 (5.3%/0.8%) |
24045 (4.5%/0.1%) |
| 60–64 | 16817924 (5.4%) |
13693334 (6.1%/81.4%) |
1686695 (4.3%/10.0%) |
611144 (2.2%/3.6%) |
689601 (4.7%/4.1%) |
118362 (4.0%/0.7%) |
18788 (3.5%/0.1%) |
| 65–69 | 12435263 (4.0%) |
10313002 (4.6%/82.9%) |
1162577 (3.0%/9.4%) |
394208 (1.4%/3.2%) |
474327 (3.2%/3.8%) |
79079 (2.7%/0.6%) |
12070 (2.2%/0.1%) |
| 70–74 | 9278166 (3.0%) |
7740932 (3.5%/83.4%) |
852317 (2.2%/9.2%) |
268574 (1.0%/2.9%) |
354268 (2.4%/3.8%) |
53926 (1.8%/0.6%) |
8149 (1.5%/0.1%) |
| 75–79 | 7317795 (2.4%) |
6224569 (2.8%/85.1%) |
616789 (1.6%/8.4%) |
184596 (0.7%/2.5%) |
251210 (1.7%/3.4%) |
35268 (1.2%/0.5%) |
5363 (1.0%/0.1%) |
| 80–84 | 5743327 (1.9%) |
5002427 (2.2%/87.1%) |
424592 (1.1%/7.4%) |
122249 (0.4%/2.1%) |
168879 (1.2%/2.9%) |
21963 (0.7%/0.4%) |
3217 (0.6%/0.1%) |
| 85+ | 5493433 (1.8%) |
4858307 (2.2%/88.4%) |
382122 (1.0%/7.0%) |
95824 (0.3%/1.7%) |
137942 (0.9%/2.5%) |
16824 (0.6%/0.3%) |
2414 (0.4%/0.0%) |
Total fertility rate (TFR)

In 1800 the average U.S. woman had 7.04 children;125 by the first decade of the 1900s, this number had already decreased to 3.56.126 Since 1971, the birth rate has generally been below the replacement rate of 2.1.127128: 3 Since the Great Recession of 2007, the rate has consistently been below replacement.127128: 3 The drop in the TFR from 2.08 per woman in 2007 to 1.76 in 2017 was mostly due to the declining birth rate of ethnic minorities, teenagers and women in their 30s.129 During that period, the birthrate for women ages 35 to 44 has risen.127129 The 12 month ending general fertility rate increased from 56.6 to 57.0 in 2022 Q1 compared to 2021 Q4.130
Total fertility rates from 1800 to 2020
The total fertility rate is the number of children born per woman. Sources: Ansley J. Coale, Zelnik and National Center for Health Statistics.131
| Years | 1800 | 1810 | 1820 | 1830 | 1840 | 1850 | 1860 | 1870 | 1880 | 1890 | 1900131 |
|---|---|---|---|---|---|---|---|---|---|---|---|
| Total Fertility Rate in the United States | 7.0 | 6.9 | 6.7 | 6.6 | 6.1 | 5.4 | 5.2 | 4.6 | 4.2 | 3.9 | 3.6 |
| Years | 1910 | 1920 | 1930 | 1940 | 1950 | 1960 | 1970 | 1980 | 1990 | 2000 | 2010131 | 2020 |
|---|---|---|---|---|---|---|---|---|---|---|---|---|
| Total Fertility Rate in the United States | 3.4 | 3.2 | 2.5 | 2.2 | 3.0 | 3.5 | 2.5 | 1.8 | 2.08 | 2.06 | 1.93 | 1.64 |
The U.S. total fertility rate as of 2020 is 1.641111
- 1.55 for non-Hispanic whites111
- 1.71 for non-Hispanic Blacks111
- 1.65 for Native Americans (including Hispanics)
- 1.53 for Asian Americans (including Hispanics)
Other:53
(Note that ≈95% of Hispanics are included as "white Hispanics" by CDC, which does not recognize the Census's "Some other race" category and counts people in that category as white.)
Source: National Vital statistics report based on 2010 US Census data132
Total fertility rates by state, federal district or territory
| State federal district or territory |
TFR |
|---|---|
| 2.13 | |
| 2.11 | |
| 2.00 | |
| 1.91 | |
| 1.85 | |
| 1.83 | |
| 1.83 | |
| 1.81 | |
| 1.81 | |
| 1.81 | |
| 1.80 | |
| 1.80 | |
| 1.79 | |
| 1.79 | |
| 1.77 | |
| 1.77 | |
| 1.76 | |
| 1.73 | |
| 1.73 | |
| 1.70 | |
| 1.69 | |
| 1.68 | |
| 1.68 | |
| 1.68 | |
| 1.67 | |
| 1.67 | |
| 1.66 | |
| 1.64 | |
| 1.63 | |
| 1.63 | |
| 1.61 | |
| 1.60 | |
| 1.60 | |
| 1.60 | |
| 1.60 | |
| 1.56 | |
| 1.55 | |
| 1.55 | |
| 1.55 | |
| 1.53 | |
| 1.52 | |
| 1.50 | |
| 1.50 | |
| 1.48 | |
| 1.47 | |
| 1.45 | |
| 1.40 | |
| 1.40 | |
| 1.40 | |
| 1.38 | |
| 1.37 | |
| 1.35 | |
| 1.30 | |
| 1.20 | |
| 0.90 | |
| 1.62 |
Births and fertility by race
A total of 3,659,289 babies were born in 2021, a 1% increase from 2020. Additionally, researchers also looked at births by race and found that White and Hispanic women each saw the number of births increase by about 2% from 2020 to 2021. Meanwhile, Black and Asian women saw the number of births decline by 2.4% and 2.5%, respectively, over the same period, while American Indian/Alaskan Native women saw their numbers fall by 3.2%.133 It also marks the first rise in births since 2014. Prior to this report, the total number of births had been decreasing by an average of 2% per year.133 However, the total fertility rate (the number of births that the average women have over their lifetimes) was 1.6635 births per every woman. This is still below the replacement level, the level a population needs to replace itself, which is, at least, 2.1 births per woman.133
Number of births by state
| States | |
|---|---|
| 57,858 | |
| 9,015 | |
| 78,096 | |
| 35,264 | |
| 400,108 | |
| 61,494 | |
| 34,559 | |
| 10,427 | |
| 7,896 | |
| 221,410 | |
| 125,120 | |
| 14,808 | |
| 22,397 | |
| 124,820 | |
| 79,000 | |
| 36,052 | |
| 34,065 | |
| 51,984 | |
| 54,927 | |
| 11,627 | |
| 65,594 | |
| 67,093 | |
| 99,124 | |
| 61,715 | |
| 34,459 | |
| 67,123 | |
| 11,078 | |
| 24,111 | |
| 31,794 | |
| 11,936 | |
| 101,001 | |
| 20,951 | |
| 203,612 | |
| 120,082 | |
| 9,647 | |
| 126,896 | |
| 47,909 | |
| 38,298 | |
| 126,951 | |
| 9,805 | |
| 57,729 | |
| 11,201 | |
| 83,021 | |
| 387,945 | |
| 45,019 | |
| 5,065 | |
| 92,649 | |
| 80,932 | |
| 16,606 | |
| 59,754 | |
| 5,990 | |
| 3,596,017 |
Number of births by country of birth of the mother (2024)
Mother's birth country (2024)
- United States (75.9%)
- Foreign countries (24.1%)
In 2024, 24.1% (873,113) of all the newborns in the US had a foreign-born mother.135
Number of births by race and origin
| General Fertility Rate: 15–44 years |
2020 Q1 | 2020 Q2 | 2020 Q3 | 2020 Q4 | 2021 Q1 | 2021 Q2 | 2021 Q3 | 2021 Q4 | 2022 Q1 | 2022 Q2 | 2022 Q3 |
|---|---|---|---|---|---|---|---|---|---|---|---|
| All races and origins | 58.1 | 57.6 | 56.8 | 56.0 | 55.0 | 55.2 | 55.6 | 56.3 | 56.6 | 56.4 | 56.2 |
| Hispanic | 65.2 | 64.7 | 63.9 | 63.1 | 61.5 | 61.7 | 62.2 | 63.4 | 64.8 | 65.1 | 65.7 |
| Non-Hispanic Black | 61.3 | 61.0 | 60.1 | 59.2 | 57.7 | 57.3 | 57.3 | 57.4 | 57.5 | 57.2 | 56.6 |
| Non-Hispanic White | 55.2 | 54.7 | 54.0 | 53.2 | 52.7 | 53.1 | 53.6 | 54.4 | 54.3 | 53.7 | 53.2 |
| Year | Total | Non-Hispanic White | Non-Hispanic Black | Hispanic | Non-Hispanic Asian | Non-Hispanic American Indian/Alaskan Native | Non-Hispanic Native Hawaiian | Multiracial |
|---|---|---|---|---|---|---|---|---|
| 2021 | 3,664,292 (TFR: 1.664) | 1,887,656 (TFR: 1.598) | 517,889 (TFR: 1.675) | 885,916 (TFR: 1.899) | 213,813 (TFR: 1.351) | 26,124 (TFR: 1.477) | 9,531 (TFR: 2.131) | 86,982 (TFR: 1.52) |
| 2020 | 3,613,647 (TFR: 1.641) | 1,843,432 (TFR: 1.551) | 529,811 (TFR: 1.713) | 866,713 (TFR: 1.879) | 219,068 (TFR: 1.379) | 26,813 (TFR: 1.520) | 9,626 (TFR: 2.134) | |
| 2019 | 3,747,540(TFR: 1.706 | 1,915,912 (TFR: 1.610) | 548,075 (TFR: 1.775) | 886,467 (TFR: 1.940) | 238,769 (TFR: 1.511) | 28,450 (TFR: 1.611) | 9.770 (TFR: 2,178) |
| Race and Hispanic origin of mother and year | January–June | January | February | March | April | May | June | Total pop.'s percent (January–June) |
|---|---|---|---|---|---|---|---|---|
| Non-Hispanic White (2019) | 937,741 | 156,819 | 142,992 | 157,502 | 156,516 | 165,587 | 158,325 | 51.67% |
| Non-Hispanic White (2020) | 916,986 | 152,519 | 138,756 | 155,981 | 150,953 | 156,888 | 156,933 | 51.43% |
| Non-Hispanic White (2021) | 914,813 | 142,083 | 138,803 | 159,055 | 153,980 | 156,969 | 163,923 | 52.32% |
| Non-Hispanic Black (2019) | 262,114 | 47,486 | 41,497 | 43,583 | 42,151 | 44,584 | 42,813 | 14.45% |
| Non-Hispanic Black (2020) | 259,759 | 46,356 | 40,587 | 43,591 | 41,395 | 42,999 | 43,381 | 14.57% |
| Non-Hispanic Black (2021) | 245,753 | 41,310 | 38,628 | 41,952 | 39,810 | 40,936 | 43,117 | 14.05% |
| Non-Hispanic American Indian or Alaska native (2019) | 14,013 | 2,525 | 2,182 | 2,332 | 2,293 | 2,382 | 2,299 | 0.77% |
| Non-Hispanic American Indian or Alaska native (2020) | 13,234 | 2,292 | 1,977 | 2,213 | 2,195 | 2,240 | 2,246 | 0.74% |
| Non-Hispanic American Indian or Alaska native (2021) | 12,498 | 2,135 | 1,932 | 2,181 | 2,098 | 1,961 | 2,191 | 0.69% |
| Non-Hispanic Asian (2019) | 116,289 | 19,628 | 17,975 | 19,910 | 19,261 | 20,168 | 19,347 | 6.41% |
| Non-Hispanic Asian (2020) | 110,811 | 19,303 | 17,068 | 19,268 | 17,986 | 18,696 | 17,880 | 6.21% |
| Non-Hispanic Asian (2021) | 102,279 | 15,658 | 15,410 | 18,019 | 17,482 | 17,552 | 18,158 | 5.85% |
| Non-Hispanic Hawaiian or other Pacific Islander (2019) | 4,695 | 790 | 762 | 814 | 738 | 847 | 744 | 0.26% |
| Non-Hispanic Hawaiian or other Pacific Islander (2020) | 4,665 | 803 | 759 | 794 | 705 | 820 | 757 | 0.26% |
| Non-Hispanic Hawaiian or other Pacific Islander (2021) | 4,413 | 799 | 616 | 753 | 731 | 806 | 708 | 0.25% |
| Hispanic (of any race) (2019) | 421,991 | 73,742 | 65,667 | 70,442 | 68,517 | 72,747 | 70,876 | 23.26% |
| Hispanic (of any race) (2020) | 420,563 | 73,601 | 65,140 | 70,361 | 68,000 | 70,085 | 71,050 | 23.59% |
| Hispanic (of any race) (2021) | 409,941 | 65,687 | 61,961 | 70,060 | 68,202 | 70,722 | 73,309 | 23.44% |
| All races and origins (2019) | 1,814,497 | 310,872 | 279,963 | 304,237 | 298,947 | 316,386 | 304,092 | |
| All races and origins (2020) | 1,783,124 | 304,722 | 272,907 | 301,625 | 290,478 | 301,481 | 302,164 | |
| All races and origins (2021) | 1,748,768 | 276,980 | 266,107 | 302,137 | 292,454 | 299,308 | 311,782 |
| Race and Hispanic origin of mother and year | January–June | January | February | March | April | May | June |
|---|---|---|---|---|---|---|---|
| Non-Hispanic White (2019-2020) | -2 | -3 | -3 | -1 | -4 | -5 | -1 |
| Non-Hispanic White (2020-2021) | †0 | -7 | †0 | 2 | 2 | †0 | 4 |
| Non-Hispanic Black (2019-2020) | -1 | -2 | -2 | †0 | -2 | -4 | †1 |
| Non-Hispanic Black (2020-2021) | -5 | -11 | -5 | -4 | -4 | -5 | †-1 |
| Non-Hispanic American Indian or Alaska native (2019-2020) | -6 | -9 | -9 | †-5 | †-4 | -6 | †-2 |
| Non-Hispanic American Indian or Alaska native (2020-2021) | -6 | -7 | †-2 | †-1 | †-4 | -12 | †-2 |
| Non-Hispanic Asian (2019-2020) | -5 | †-2 | -5 | -3 | -7 | -7 | -8 |
| Non-Hispanic Asian (2020-2021) | -8 | -19 | -10 | -6 | -3 | -6 | †2 |
| Non-Hispanic Hawaiian or other Pacific Islander (2019-2020) | †-1 | †2 | †0 | †-2 | †-4 | †-3 | †2 |
| Non-Hispanic Hawaiian or other Pacific Islander (2020-2021) | 5 | †0 | -19 | †-5 | †4 | †-2 | †-6 |
| Hispanic (of any race) (2019-2020) | †0 | †0 | †-1 | †0 | †-1 | -4 | †0 |
| Hispanic (of any race) (2020-2021) | -3 | -11 | -5 | †0 | †0 | †1 | 3 |
| All races and origins (2019-2020) | -2 | -2 | -3 | -1 | -3 | -5 | -1 |
| All races and origins (2020-2021) | -2 | -9 | -2 | †0 | 1 | -1 | 3 |
U.S.-born residents
Note: Hispanics are counted both by their ethnicity and by their race, giving a higher overall number. Also note that growth arrows indicate an increase or decrease in the number of births, not in the fertility rate.53141142143
| Race of mother | Number of births in 2016 |
% of all born |
TFR (2016) |
Number of births in 2017 |
% of all born |
TFR (2017) |
Number of births in 2018 |
% of all born |
TFR (2018) |
Number of births in 2019 |
% of all born |
TFR (2019) |
Number of births in 2020 |
% of all born |
TFR (2020) |
2020-2016
|
|---|---|---|---|---|---|---|---|---|---|---|---|---|---|---|---|---|
| White | 2,900,933 | 73.5% | 1.77 | 2,812,267 | 72.9% | 1.76 | 2,788,439 | 73.5% | 1.75 | |||||||
| > NH White | 2,056,332 | 52.1% | 1.719 | 1,992,461 | 51.7% | 1.666 | 1,956,413 | 51.6% | 1.640 | 1,915,912 | 51.1% | 1.611 | 1,843,432 | 51.0% | 1.552 | |
| Black | 623,886 | 15.8% | 1.90 | 626,027 | 16.2% | 1.92 | 600,933 | 15.8% | 1.87 | |||||||
| > NH Black | 558,622 | 14.2% | 1.832 | 560,715 | 14.5% | 1.824 | 552,029 | 14.6% | 1.792 | 548,075 | 14.6% | 1.776 | 529,811 | 14.7% | 1.714 | |
| NH Asian | 254,471 | 6.5% | 1.690 | 249,250 | 6.5% | 1.597 | 240,798 | 6.4% | 1.525 | 238,769 | 6.4% | 1.511 | 219,068 | 6.1% | 1.385 | |
| NH American Indian or Alaska native | 31,452 | 0.8% | 1.794 | 29,957 | 0.8% | 1.702 | 29,092 | 0.8% | 1.651 | 28,450 | 0.76% | 1.612 | 26,813 | 0.74% | 1.517 | |
| NH Hawaiian (incl. other Pacific Islander) | 9,342 | 0.2% | 2.076 | 9,426 | 0.2% | 2.085 | 9,476 | 0.3% | 2.106 | 9,770 | 0.26% | 2.178 | 9,626 | 0.26% | 2.142 | |
| Total | 3,945,875 | 100% | 1.820 | 3,855,500 | 100% | 1.765 | 3,791,712 | 100% | 1.729 | 3,747,540 | 100% | 1.706 | 3,613,647 | 100% | 1.641 |
Key:
- NH = Non-Hispanic.
- TFR = Total fertility rate (number of children born per woman).
- Growth arrows (
 /
/ ) indicate an increase or decrease in the number of births, not in the fertility rate, comparing to the previous year.
| Ethnicity of mother | Number of births in 2016 |
% of all born |
TFR (2016) |
Number of births in 2017 |
% of all born |
TFR (2017) |
Number of births in 2018 |
% of all born |
TFR (2018) |
Number of births in 2019 |
% of all born |
TFR (2019) |
Number of births in 2020 |
% of all born |
TFR (2020) |
2020-2016
|
|---|---|---|---|---|---|---|---|---|---|---|---|---|---|---|---|---|
| Non-Hispanic (of any race) | 3,027,428 | 2,956,736 | 2,905,502 | 2,861,073 | 2,746,933 | |||||||||||
| Hispanic (of any race) | 918,447 | 23.3% | 2.093 | 898,764 | 23.3% | 2.007 | 886,210 | 23.4% | 1.959 | 886,467 | 23.7% | 1.940 | 866,714 | 24.0% | 1.876 |
| Race | 2008 | 2011 | 2013 |
|---|---|---|---|
| White | 2.29 | 2.01 | 1.94 |
| Black | 2.51 | 2.57 | 2.35 |
| Asian | 2.25 | 2.02 | 1.93 |
| Other | 1.80 | 2.04 | 2.06 |
| Hispanic (of any race) | 3.15 | 2.77 | 2.46 |
| Total | 2.75 | 2.45 | 2.22 |
Percent of births to White Non-Hispanic women that were their 8th+ child, by U.S. state, in 2021
| State | Percent |
|---|---|
| 2.21% | |
| 1.7% | |
| 1.04% | |
| 1.02% | |
| 0.86% | |
| 0.85% | |
| 0.84% | |
| 0.82% | |
| 0.76% | |
| 0.76% | |
| 0.75% | |
| 0.75% | |
| 0.72% | |
| 0.72% | |
| 0.7% | |
| 0.7% | |
| 0.65% | |
| 0.64% | |
| 0.62% | |
| 0.59% | |
| 0.54% | |
| 0.51% | |
| 0.50% | |
| 0.49% | |
| 0.46% | |
| 0.44% | |
| 0.44% | |
| 0.43% | |
| 0.42% | |
| 0.41% | |
| 0.40% | |
| 0.40% | |
| 0.39% | |
| 0.38% | |
| 0.36% | |
| 0.36% | |
| 0.33% | |
| 0.33% | |
| 0.32% | |
| 0.31% | |
| 0.30% | |
| 0.29% | |
| 0.29% | |
| 0.25% | |
| 0.25% | |
| 0.20% | |
| 0.19% | |
| 0.17% |
Mother's mean age at first birth
- 27.1 years (2020 est.)111
Life expectancy
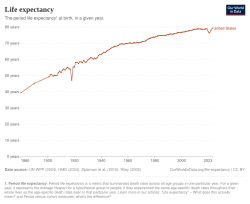
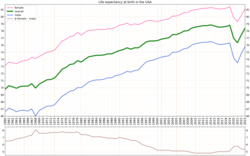
According to the Centers for Disease Control and Prevention (CDC), average American life expectancy at birth was 79.0 years in 2024, a record high.145 This was a gain of 0.6 years from 78.4 years in 2023.146 Average life expectancy was 76.4 years in 2021.147: 1
- Male: 76.5 (2024), 75.8 years (2023), 74.8 years (2022), 73.5 years (2021)148
- Female: 81.4 years (2024), 81.1 years (2023), 80.2 years (2022), 79.3 years (2021)149
Starting in 1998, life expectancy in the U.S. fell behind that of other wealthy industrialized countries, and Americans' "health disadvantage" gap has been increasing ever since.150 Average U.S. life expectancy in the United States has actually declined in four of the years following 2014 (the year when average U.S. life expectancy reached 78.9 years, its historical peak).151 These declines were mostly reversed in 2022 (+1.1 years), 2023 (+0.9 years), and 2024 (+0.6 years). The CDC attributed the improvement in 2024 to a significant fall in the number of fatal drug overdoses, adding that "heart disease continues to be the leading cause of death in the United States, followed by cancer and unintentional injuries."152153 As of 2024, death rates among the youngest in the U.S. remain well higher than in peer nations.153 In 2023, there had already been lower death rates in each of the ten U.S. leading causes of death, with gains in life expectancy largely driven by "decreases in mortality due to COVID-19, heart disease, unintentional injuries, cancer and diabetes".153154
From 2019 to 2020, the COVID-19 pandemic had contributed to approximately 61% of the decrease in life expectancy in the United States.155 While increases in mortality from unintentional injuries, heart disease, homicide, and diabetes contributed to 11.7%, 5.8%, 2.9%, and 2.8% of the decrease in life expectancy from 2019 to 2020, respectively.155 Life expectancy has also varied by racial and ethnic group, with Non-Hispanic Asians having the highest life expectancy and Non-Hispanic American Indians having the lowest.155 In 2021, life expectancy at birth in the United States fell for the second year in a row, the first two-year drop since 1961–1963.156
| Race | Males 2021 |
Females 2021 |
Total 2021* |
Total 2020 |
Total 2019 |
2019 to 2021 |
|---|---|---|---|---|---|---|
| NH White | 73.7 | 79.2 | 76.4 | 77.4 | 78.8 | |
| NH Black | 66.7 | 74.8 | 70.8 | 71.5 | 74.8 | |
| NH Asian | 81.2 | 85.6 | 83.5 | 83.6 | 85.6 | |
| NH American Indian or Alaska Native | 61.5 | 69.2 | 65.2 | 67.1 | 71.8 | |
| Hispanic | 74.4 | 81.0 | 77.7 | 77.9 | 81.9 | |
| All origins and races | 73.2 | 79.1 | 76.1 | 77.0 | 78.8 |
NOTE: Data regarding life expectancy at birth for 2021 are provisional.*
- NH = Non-Hispanic.
- LEB = Life expectancy at birth
- Growth arrows (/) indicate an increase or decrease in total life expectancy compared to years before.
Life expectancy at birth from 1901 to 2015
Life expectancy in the United States from 1901 to 2015. Source: Our World In Data and the United Nations.
1901–1950
| Years | 1901 | 1902 | 1903 | 1904 | 1905 | 1906 | 1907 | 1908 | 1909 | 1910158 |
|---|---|---|---|---|---|---|---|---|---|---|
| Life expectancy in the United States | 49.3 | 50.5 | 50.6 | 49.6 | 50.3 | 50.2 | 50.1 | 51.9 | 52.8 | 51.8 |
| Years | 1911 | 1912 | 1913 | 1914 | 1915 | 1916 | 1917 | 1918 | 1919 | 1920158 |
|---|---|---|---|---|---|---|---|---|---|---|
| Life expectancy in the United States | 53.4 | 54.1 | 53.5 | 54.6 | 55.1 | 54.2 | 54.0 | 47.0 | 55.3 | 55.4 |
| Years | 1921 | 1922 | 1923 | 1924 | 1925 | 1926 | 1927 | 1928 | 1929 | 1930158 |
|---|---|---|---|---|---|---|---|---|---|---|
| Life expectancy in the United States | 58.2 | 58.1 | 57.5 | 58.5 | 58.5 | 57.9 | 59.4 | 58.3 | 58.5 | 59.6 |
| Years | 1931 | 1932 | 1933 | 1934 | 1935 | 1936 | 1937 | 1938 | 1939 | 1940158 |
|---|---|---|---|---|---|---|---|---|---|---|
| Life expectancy in the United States | 60.3 | 61.0 | 60.9 | 60.2 | 60.9 | 60.4 | 61.1 | 62.4 | 63.1 | 63.2 |
| Years | 1941 | 1942 | 1943 | 1944 | 1945 | 1946 | 1947 | 1948 | 1949 | 1950158 |
|---|---|---|---|---|---|---|---|---|---|---|
| Life expectancy in the United States | 63.8 | 64.6 | 64.3 | 65.1 | 65.6 | 66.3 | 66.7 | 67.3 | 67.6 | 68.1 |
1901–2015
| Period | Life expectancy in Years |
|---|---|
| 1901–1909 | 49.3 – 52.8 |
| 1910–1919 | 53.5 – 55.3159 |
| 1920–1929 | 55.4 – 59.4 |
| 1930–1939 | 60.2 – 63.1 |
| 1940–1949 | 63.8 – 67.6 |
| 1950–1955 | 68.7 |
| 1955–1960 | 69.7 |
| 1960–1965 | 70.1 |
| 1965–1970 | 70.4 |
| 1970–1975 | 71.4 |
| 1975–1980 | 73.3 |
| 1980–1985 | 74.4 |
| 1985–1990 | 74.9 |
| 1990–1995 | 75.7 |
| 1995–2000 | 76.5 |
| 2000–2005 | 77.2 |
| 2005–2010 | 78.2 |
| 2010–2015 | 78.9 |
| 2015–2020 | 78.8 |
| 2022160 | 77.5 |
| 2023160 | 78.4 |
| 2024161 | 79.0 |
Source: UN World Population Prospects162
Life tables
| Females | Males | Total | ||||
|---|---|---|---|---|---|---|
| Age | Cohort | Life expectancy | Cohort | Life expectancy | Cohort | Life expectancy |
| 0 | 100,000 | 79.9 | 100,000 | 74.2 | 100,000 | 77.0 |
| 1 | 99,508 | 79.3 | 99,415 | 73.6 | 99,461 | 76.4 |
| 5 | 99,429 | 75.3 | 99,313 | 69.7 | 99,377 | 72.5 |
| 10 | 99,381 | 70.4 | 99,254 | 64.7 | 99,323 | 67.5 |
| 15 | 99,317 | 65.4 | 99,155 | 59.8 | 99,242 | 62.6 |
| 20 | 99,157 | 60.5 | 98,741 | 55.0 | 98,952 | 57.7 |
| 25 | 98,876 | 55.7 | 97,961 | 50.5 | 98,415 | 53.0 |
| 30 | 98,479 | 50.9 | 96,994 | 45.9 | 97,725 | 48.4 |
| 35 | 97,933 | 46.2 | 95,815 | 41.5 | 96,856 | 43.8 |
| 40 | 97,215 | 41.5 | 94,420 | 37.0 | 95,794 | 39.3 |
| 45 | 96,266 | 36.9 | 92,731 | 32.7 | 94,471 | 34.8 |
| 50 | 94,928 | 32.4 | 90,497 | 28.4 | 92,680 | 30.4 |
| 55 | 92,979 | 28.0 | 87,332 | 24.3 | 90,115 | 26.2 |
| 60 | 90,111 | 23.8 | 82,736 | 20.5 | 86,376 | 22.2 |
| 65 | 86,039 | 19.8 | 76,439 | 17.0 | 81,181 | 18.5 |
| 70 | 80,547 | 15.9 | 68,491 | 13.7 | 74,466 | 14.9 |
| 75 | 72,737 | 12.4 | 58,588 | 10.6 | 65,565 | 11.6 |
| 80 | 61,298 | 9.2 | 45,661 | 7.8 | 53,346 | 8.6 |
| 85 | 45,424 | 6.5 | 30,276 | 5.5 | 37,700 | 6.1 |
| 90 | 26,271 | 4.4 | 14,824 | 3.7 | 20,477 | 4.2 |
| 95 | 9,599 | 2.9 | 4,216 | 2.5 | 6,889 | 2.8 |
| 100 | 1,727 | 2.0 | 549 | 1.8 | 1,142 | 2.0 |
Future projections
In 2023, the U.S. Census Bureau published an updated projection of the U.S. population for 2023–2100, taking into account the results of the 2020 census. The future size and composition of the U.S. population were estimated using the cohort-component method and historical trends in fertility, mortality, and international migration163. The projection included a main variant and three alternative variants reflecting different international migration scenarios ("high immigration", "low immigration", and "zero immigration"), since immigration is the most uncertain component in population forecasting164.
View source data.
| states | 2030 | 2040 |
|---|---|---|
| 5,029,833 | 5,056,796 | |
| 792,188 | 819,954 | |
| 8,238,407 | 9,166,279 | |
| 3,155,798 | 3,217,535 | |
| 43,751,116 | 46,467,001 | |
| 6,766,983 | 7,692,907 | |
| 3,601,202 | 3,542,707 | |
| 1,082,192 | 1,164,344 | |
| 888,891 | 1,058,820 | |
| 25,372,664 | 28,886,983 | |
| 11,835,126 | 12,820,271 | |
| 1,548,831 | 1,619,703 | |
| 2,008,329 | 2,227,842 | |
| 12,709,901 | 12,397,564 | |
| 6,978,254 | 7,095,000 | |
| 3,317,412 | 3,392,783 | |
| 3,011,782 | 3,032,653 | |
| 4,648,190 | 4,714,761 | |
| 4,945,783 | 5,062,780 | |
| 1,344,841 | 1,326,159 | |
| 6,553,548 | 6,842,902 | |
| 7,420,882 | 7,742,628 | |
| 10,068,941 | 9,960,115 | |
| 6,070,551 | 6,364,886 | |
| 3,003,963 | 2,962,160 | |
| 6,318,126 | 6,359,970 | |
| 1,163,353 | 1,236,304 | |
| 2,089,841 | 2,190,918 | |
| 3,591,043 | 4,058,371 | |
| 1,385,799 | 1,393,451 | |
| 9,363,317 | 9,470,012 | |
| 2,132,823 | 2,127,318 | |
| 20,638,066 | 20,873,488 | |
| 11,673,849 | 12,658,927 | |
| 923,452 | 1,060,457 | |
| 11,837,405 | 11,751,540 | |
| 4,253,604 | 4,439,038 | |
| 4,738,074 | 5,164,041 | |
| 12,946,245 | 12,809,150 | |
| 1,068,663 | 1,055,318 | |
| 5,792,247 | 6,352,502 | |
| 973,361 | 1,043,032 | |
| 7,395,106 | 7,823,662 | |
| 34,738,482 | 40,015,913 | |
| 3,786,963 | 4,344,339 | |
| 617,969 | 601,865 | |
| 9,331,666 | 9,876,728 | |
| 8,746,493 | 9,776,126 | |
| 1,746,577 | 1,661,849 | |
| 5,971,617 | 5,997,137 | |
| 605,972 | 615,787 |
Race, ethnicity, & other groups
Hispanics and Non-Hispanics in the United States (2020 United States census)10
- Non-Hispanic Americans (81.3%)
- Hispanic Americans (18.7%)
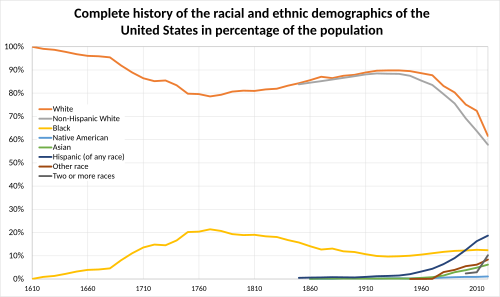
The following table shows the race and ethnicity of the United States per the 1930, 1970, 2000, and 2020 censuses. Data only covers states and the federal district, thus only covering the first 48 states and Washington, D.C. in 1930 and including Alaska and Hawaii as well in 1970, 2000, and 2020. The figures thus do not include various other territories that have been under the United States during this time period.a Over this time period, the U.S. has evolved from being 89% White, 10% Black and 1% Hispanic in 1930 to 58% White, 12% Black, and 19% Hispanic ninety years later, reflecting a significant demographic shift.
| Race and ethnicity | 1930166 | 1970167168 | 2000169 | 2020170 | ||||
|---|---|---|---|---|---|---|---|---|
| Pop. | % | Pop. | % | Pop. | % | Pop. | % | |
| White | 108,864,207 | 88.67% | 169,282,849 | 83.3% | 194,552,774 | 69.13% | 191,697,647 | 57.84% |
| Hispanic or Latinob | 1,422,533c | 1.16% | 9,072,602 | 4.46% | 35,305,818 | 12.55% | 62,080,044 | 18.73% |
| Black or African Americand | 11,891,143 | 9.69% | 22,125,355 | 10.89% | 33,947,837 | 12.06% | 39,940,338 | 12.05% |
| Asiane | 264,100f | 0.22% | 1,965,249g | 0.97% | 10,123,169 | 3.6% | 19,618,719 | 5.92% |
| American Indian and Alaska Nativeh | 332,397 | 0.27% | 765,871 | 0.38% | 2,068,883 | 0.74% | 2,251,699 | 0.68% |
| Native Hawaiian and Other Pacific Islanderi | 666j | 0% | n/a | n/a | 353,509 | 0.13% | 622,018 | 0.19% |
| Some Other Racek | n/a | n/a | n/a | n/a | 467,770 | 0.17% | 1,689,833 | 0.51% |
| Two or more racesl | n/a | n/a | n/a | n/a | 4,602,146 | 1.64% | 13,548,983 | 4.09% |
| Total responses | 122,775,046 | 100% | 203,211,926 | 100% | 281,421,906 | 100% | 331,449,281 | 100% |
Racial groups in the United States (2020 census) including racial identification of Hispanic171
- White Americans (61.6%)
- Black Americans (12.4%)
- Two or more races (10.2%)
- Some other race (8.40%)
- Asian Americans (6.00%)
- Native Americans (1.10%)
- Pacific Islander Americans (0.20%)
| Americans in 2020 (Hispanics Incorporated) | ||||||
|---|---|---|---|---|---|---|
| Year | Population | Percent | Percent Change | |||
| White (alone) | 204,277,273 | 61.6% | ||||
| African (alone) | 41,104,200 | 12.4% | ||||
| Asian (alone) | 19,886,049 | 6.0% | ||||
| Multiracial | 33,848,943 | 10.2% | ||||
| Native (alone) | 3,727,135 | 1.1% | ||||
| Pacific Islander (alone) | 689,966 | 0.23% | ||||
| Some Other Race (alone) | 27,915,715 | 0.63% | ||||
| Total | 331,449,281 | 100% | ||||
| Source: 2020 United States census10 | ||||||
Racial Hispanic groups in the United States (2020 United States census)10
| Hispanic Americans in 2020 | |||||||
|---|---|---|---|---|---|---|---|
| Year | Population | % of Hispanics |
% of the US |
Percent Change | |||
| Multiracial | 20,299,960 | 32.70% | 6.12% | ||||
| White (alone) | 12,579,626 | 20.26% | 3.80% | ||||
| Native (alone) | 1,475,436 | 2.38% | 0.45% | ||||
| African (alone) | 1,163,862 | 1.87% | 0.35% | ||||
| Asian (alone) | 267,330 | 0.43% | 0.08% | ||||
| Pacific Islander (alone) | 67,948 | 0.11% | 0.02% | ||||
| Some Other Race (alone) | 26,225,882 | 42.25% | 7.91% | ||||
| Total | 62,080,044 | 100% | 18.73% | ||||
| Source: 2020 United States census10 | |||||||
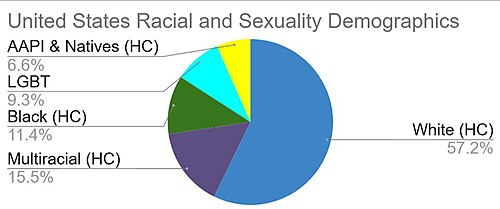

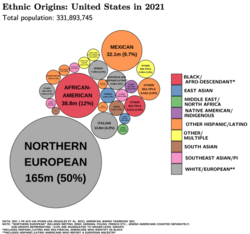
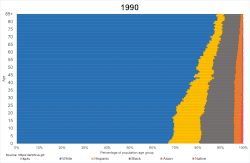
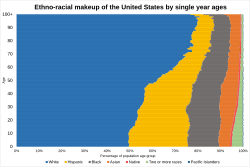
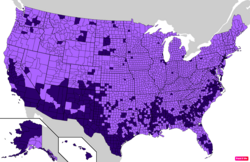
Counties in the United States by percentage of the population which is non-Hispanic or Latino and/or non-white according to the U.S. Census Bureau American Community Survey 2013–2017 5-Year Estimates.172 Counties with larger populations of Hispanic/Latino and/or non-white than the United States as a whole are in full purple.
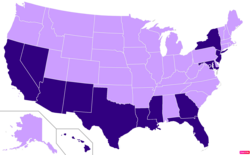
States in the United States by Hispanic/Latino and/or non-white population according to the U.S. Census Bureau American Community Survey 2013–2017 5-Year Estimates.172 States with larger Hispanic/Latino and/or non-white populations than the United States as a whole are in full purple.
| Racial and Sexual Orientation Demographics in 2020 | ||
|---|---|---|
| Race and Sexuality | Population | Percent |
| White (HC) | 189,596,612 | 57.20 |
| Multiracial (HC) | 51,267,912 | 15.47 |
| Foundational Blacks (HC) | 34,163,140 | 10.31 |
| LGBT | 30,824,783 | 9.30 |
| AAPI and Natives (HC) | 21,944,594 | 6.62 |
| Black Immigrants (HC) | 3,638,319 | 1.10 |
| Total | 331,449,281 | 100.00 |
| Source: 2020 United States census10 | HC-Heterosexual and Cisgender | |
Race
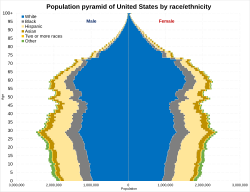
The United States Census Bureau collects racial data in accordance with guidelines provided by the U.S. Office of Management and Budget (OMB), and these data are based on self-identification. Many other countries count multiple races based on origin while America compiles multiple dozens of ethnicity groups into skin color grouping them together.173 The racial classifications and definitions used by the U.S. Census Bureau are:174
- White: a person having origins in any of the original peoples of Europe, the Middle East, or North Africa.175 It includes people who indicate their race as "White" or report entries such as English, Azerbaijani, Iranian (Kurd and Lur), Irish, German, Italian, Spanish, Portuguese, Greek, Turkish, Lebanese, Moroccan (Arab and Berber), or Caucasian.
- Black or African American: a person having origins in any of the Black racial groups of Africa.175 It includes people who indicate their race as "Black, African Am." or report entries such as African American, Kenyan, Nigerian, or Haitian.
- American Indian or Alaska Native: a person having origins in any of the original peoples of North and South America (including Central America) and who maintains tribal affiliation or community attachment.175 This category includes people who indicate their race as "American Indian or Alaska Native" or report entries such as Navajo, Blackfeet, Inupiat, Yup'ik, Central American Indian groups, or South American Indian groups.
- Asian: a person having origins in any of the original peoples of East Asia, Southeast Asia, or South Asia, such as Cambodia, China, India, Japan, Korea, Malaysia, Pakistan, the Philippine Islands, Thailand, and Vietnam.175
- Native Hawaiian or Other Pacific Islander: a person having origins in any of the original peoples of Hawaii, Guam, Samoa, or other Pacific Islands.175
- Some other race: includes all other responses not included in the "White", "Black or African American", "American Indian or Alaska Native", "Asian", and "Native Hawaiian or other Pacific Islander" racial categories described above includes Asians from West Asia or Russia (non-European Russia) and White Africans.
- Two or more races: people may choose to provide two or more races either by checking two or more race response check boxes, providing multiple responses, or some combination of check boxes and other responses.
Data about race and ethnicity are self-reported to the Census Bureau. Since the 2000 census, Congress has authorized people to identify themselves according to more than one racial classification by selecting more than one category. Only one ethnicity may be selected, however, because the Census Bureau recognizes only two ethnicities – "Hispanic or Latino" and "Not Hispanic or Latino" – which are mutually exclusive since you can be one or the other, but not both. The singular term Hispanic has been supplanted as a federally-recognized ethnicity by the combined "Hispanic or Latino," defined by the Census Bureau as a person of Cuban, Mexican, Puerto Rican, Cuban, South or Central American, or other Spanish culture or origin, regardless of race.176
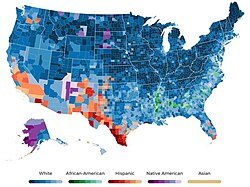
According to the Census Bureau website, the racial composition of the United States in 2021 was:177
| Race (2021) | Population | Share of population |
|---|---|---|
| Total | 323,175,700 | 100.0% |
| (Non-Hispanic) White, percent | 187,925,100 | 58.2% |
| (Non-Hispanic) Black or African American, percent | 37,520,800 | 11.6% |
| Hispanic or Latino, percent | 61,241,900 | 19.0% |
| (Non-Hispanic) Asian, percent | 18,558,600 | 5.7% |
| (Non-Hispanic) American Indian and Alaska Native, percent | 1,667,100 | 0.5% |
| (Non-Hispanic) Native Hawaiian and Other Pacific Islander | 541,200 | 0.2% |
| Two or more Races, percent | 15,711,100 | 4.9% |
According to the 2022 American Community Survey, the racial composition of the United States in 2022 was:178179
| Race | Population (2022 est.) | Share of total population |
|---|---|---|
| Total | 333,287,550 | 100% |
| One race | 291,505,262 | 87.5% |
| White | 202,889,020 | 60.2% |
| Black or African American | 40,603,656 | 12.2% |
| American Indian and Alaska Native | 3,205,331 | 1% |
| Asian | 19,696,980 | 5.9% |
| Native Hawaiian and Other Pacific Islander | 665,807 | 0.2% |
| Other races | 24,444,482 | 7.3% |
| Two or more races | 41,782,288 | 12.5% |
| White and Black or African American | 3,831,683 | 1.1% |
| White and American Indian and Alaska Native | 3,012,849 | 0.9% |
| White and Asian | 2,865,504 | 0.9% |
| Black or African American and American Indian and Alaska Native | 464,679 | 0.1% |
| White and Some Other Race | 26,317,236 | 7.9% |
| Hispanic or Latino (of any race) | 63,553,640 | 19.1% |
| Mexican | 37,414,772 | 11.2% |
| Central American | 6,531,267 | 2% |
| Puerto Rican | 5,905,178 | 1.8% |
| South American | 4,666,970 | 1.4% |
| Cuban | 2,435,573 | 0.7% |
| Dominican | 2,396,784 | 0.7% |
| Other Hispanic or Latino | 4,203,095 | 1.3% |
| Not Hispanic or Latino | 269,733,920 | 80.9% |
| White (non-Hispanic) | 192,153,070 | 57.7% |
| Black or African American (non-Hispanic) | 39,582,960 | 11.9% |
| American Indian and Alaska Native (non-Hispanic) | 1,750,489 | 0.5% |
| Asian (non-Hispanic) | 19,415,252 | 5.8% |
| Native Hawaiian and Other Pacific Islander (non-Hispanic) | 590,339 | 0.2% |
| Some other race (non-Hispanic) | 1,912,680 | 0.6% |
| Two or more races | 14,329,127 | 4.3% |
- United States in racial groups (of one race)
-
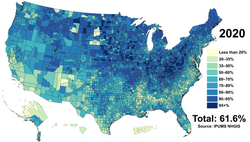
-

-
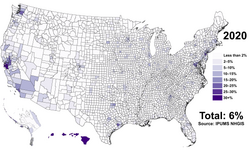
- United States in ethnic groups
-
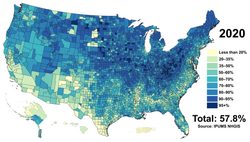
-
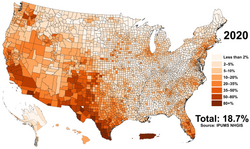
- Distribution of Total Population by Race, 1900 to 2020 (in %)
Hispanic are shown like part of the races. Source: U.S. Census Bureau.18072
| Years | 1900 | 1910 | 1920 | 1930 | 1940 | 1950 | 1960 | 1970 | 1980 | 1990 | 2000* | 2010* | 2020* |
|---|---|---|---|---|---|---|---|---|---|---|---|---|---|
| White | 87.9 | 88.9 | 89.7 | 89.8 | 89.8 | 89.5 | 88.6 | 87.5 | 83.0 | 80.3 | 75.1 | 72.4 | 61.6 |
| Black or African American | 11.6 | 10.7 | 9.9 | 9.7 | 9.8 | 10.0 | 10.5 | 11.1 | 11.7 | 12.1 | 12.3 | 12.6 | 12.4 |
| American Indian and Alaska Native | 0.8 | 0.8 | 0.9 | 0.9 | 1.1 | ||||||||
| Asian and Native Hawaiian and other Pacific Islander |
1.5 | 2.9 | 3.8 | 5.0 | 6.2 | ||||||||
| Some other race | 3.0 | 3.9 | 5.5 | 6.2 | 8.4 | ||||||||
| Two or more races | 2.4 | 2.9 | 10.2 | ||||||||||
| Sum (%) | 99.5 | 99.6 | 99.6 | 99.5 | 99.6 | 99.5 | 99.1 | 98.6 | 100 | 100 | 100 | 100 | 100 |
*Data are shown for the White, Black or African American, American Indian and Alaska Native, Asian and Native Hawaiian and Other Pacific Islander, and Some other race alone populations.
- Median age by each race alone and ethnicity, 2021
Source: United States Census Bureau.181
| Race | Median age (both sexes) (years) | Median age (male) (years) | Median age (female) (years) |
|---|---|---|---|
| Total Population | 38.8 | 37.7 | 39.8 |
| White (Non-Hispanic) | 43.8 | 42.6 | 45.0 |
| Black or African American (Non-Hispanic) | 34.5 | 32.9 | 36.1 |
| American Indian and Alaska Native (Non-Hispanic) | 32.1 | 31.8 | 32.5 |
| Asian (Non-Hispanic) | 37.7 | 36.5 | 38.9 |
| Native Hawaiian and Other Pacific Islander (Non-Hispanic) | 32.7 | 32.5 | 32.9 |
| Two or More Races | 29.5 (2020)182 | 20.4 | 21.8 |
| Hispanic alone | 30.5 | 30.2 | 30.8 |
| Not Hispanic | 41.0 | 39.8 | 42.1 |
- Median age by race alone or in combination and ethnicity, 2021
Source: United States Census Bureau.181
| Race | Median age (both sexes) (years) | Median age (male) (years) | Median age (female) (years) |
|---|---|---|---|
| White (include White Hispanics) | 39.8 | 38.9 | 40.8 |
| Black or African American | 32.7 | 31.2 | 34.2 |
| American Indian and Alaska Native | 31.6 | 30.9 | 32.2 |
| Asian | 35.4 | 34.1 | 36.6 |
| Native Hawaiian and Other Pacific Islander | 29.8 | 29.3 | 30.3 |
| White (excludes White Hispanics) | 42.8 | 41.7 | 44.0 |
| Race/ethnicity | White | Black or African American |
Hispanic | Asian | American Indian and Alaska Native |
Native Hawaiian and Pacific Islander |
Multiracial |
|---|---|---|---|---|---|---|---|
| Most common age | 58 yo | 27 yo | 11 yo | 29 yo | 26 yo | 28 yo | 3 yo |
| State or territory | Population
(2015 est.) |
White | Black or
African American |
American Indian
and Alaska Native |
Asian | Native Hawaiian and
Other Pacific Islander |
Some other race | Two or more races |
|---|---|---|---|---|---|---|---|---|
| Alabama | 4,830,620 | 68.8% | 26.4% | 0.5% | 1.2% | 0.1% | 1.3% | 1.7% |
| Alaska | 733,375 | 66.0% | 3.4% | 13.8% | 5.9% | 1.2% | 1.3% | 8.4% |
| Arizona | 6,641,928 | 78.4% | 4.2% | 4.4% | 3.0% | 0.2% | 6.5% | 3.2% |
| Arkansas | 2,958,208 | 78.0% | 15.5% | 0.6% | 1.4% | 0.2% | 2.1% | 2.1% |
| California | 38,421,464 | 61.8% | 5.9% | 0.7% | 13.7% | 0.4% | 12.9% | 4.5% |
| Colorado | 5,278,906 | 84.2% | 4.0% | 0.9% | 2.9% | 0.1% | 4.3% | 3.5% |
| Connecticut | 3,593,222 | 77.3% | 10.3% | 0.2% | 4.2% | 0.0% | 5.1% | 2.8% |
| Delaware | 926,454 | 69.4% | 21.6% | 0.3% | 3.6% | 0.0% | 2.3% | 2.7% |
| District of Columbia | 647,484 | 40.2% | 48.9% | 0.3% | 3.7% | 0.0% | 4.2% | 2.7% |
| Florida | 19,645,772 | 76.0% | 16.1% | 0.3% | 2.6% | 0.1% | 2.5% | 2.4% |
| Georgia | 10,006,693 | 60.2% | 30.9% | 0.3% | 3.6% | 0.0% | 2.8% | 2.1% |
| Hawaii | 1,406,299 | 25.4% | 2.0% | 0.2% | 37.7% | 9.9% | 1.1% | 23.7% |
| Idaho | 1,616,547 | 91.7% | 0.6% | 1.3% | 1.3% | 0.1% | 2.4% | 2.6% |
| Illinois | 12,873,761 | 72.3% | 14.3% | 0.2% | 5.0% | 0.0% | 5.8% | 2.2% |
| Indiana | 6,568,645 | 84.2% | 9.2% | 0.2% | 1.9% | 0.0% | 2.3% | 2.2% |
| Iowa | 3,093,526 | 91.2% | 3.2% | 0.3% | 2.0% | 0.1% | 1.3% | 2.0% |
| Kansas | 2,892,987 | 85.2% | 5.8% | 0.8% | 2.6% | 0.1% | 2.2% | 3.3% |
| Kentucky | 4,397,353 | 87.6% | 7.9% | 0.2% | 1.3% | 0.0% | 0.9% | 2.1% |
| Louisiana | 4,625,253 | 62.8% | 32.1% | 0.6% | 1.7% | 0.0% | 1.0% | 1.8% |
| Maine | 1,329,100 | 95.0% | 1.1% | 0.6% | 1.1% | 0.0% | 0.2% | 2.0% |
| Maryland | 5,930,538 | 57.6% | 29.5% | 0.3% | 6.0% | 0.0% | 3.6% | 3.0% |
| Massachusetts | 6,705,586 | 79.6% | 7.1% | 0.2% | 6.0% | 0.0% | 4.2% | 2.9% |
| Michigan | 9,900,571 | 79.0% | 14.0% | 0.5% | 2.7% | 0.0% | 1.1% | 2.6% |
| Minnesota | 5,419,171 | 84.8% | 5.5% | 1.0% | 4.4% | 0.0% | 1.5% | 2.7% |
| Mississippi | 2,988,081 | 59.2% | 37.4% | 0.4% | 1.0% | 0.0% | 0.9% | 1.2% |
| Missouri | 6,045,448 | 82.6% | 11.5% | 0.4% | 1.8% | 0.1% | 1.1% | 2.4% |
| Montana | 1,014,699 | 89.2% | 0.5% | 6.5% | 0.7% | 0.1% | 0.5% | 2.5% |
| Nebraska | 1,869,365 | 88.1% | 4.7% | 0.9% | 2.0% | 0.1% | 1.9% | 2.2% |
| Nevada | 2,798,636 | 69.0% | 8.4% | 1.1% | 7.7% | 0.6% | 8.8% | 4.4% |
| New Hampshire | 1,324,201 | 93.7% | 1.3% | 0.2% | 2.4% | 0.0% | 0.5% | 1.8% |
| New Jersey | 8,904,413 | 68.3% | 13.5% | 0.2% | 9.0% | 0.0% | 6.4% | 2.5% |
| New Mexico | 2,084,117 | 73.2% | 2.1% | 9.1% | 1.4% | 0.1% | 10.9% | 3.3% |
| New York | 19,673,174 | 64.6% | 15.6% | 0.4% | 8.0% | 0.0% | 8.6% | 2.9% |
| North Carolina | 9,845,333 | 69.5% | 21.5% | 1.2% | 2.5% | 0.1% | 3.0% | 2.4% |
| North Dakota | 721,640 | 88.7% | 1.6% | 5.3% | 1.2% | 0.0% | 0.8% | 2.2% |
| Ohio | 11,575,977 | 82.4% | 12.2% | 0.2% | 1.9% | 0.0% | 0.8% | 2.5% |
| Oklahoma | 3,849,733 | 73.1% | 7.2% | 7.3% | 1.9% | 0.1% | 2.6% | 7.8% |
| Oregon | 3,939,233 | 85.1% | 1.8% | 1.2% | 4.0% | 0.4% | 3.4% | 4.1% |
| Pennsylvania | 12,779,559 | 81.6% | 11.0% | 0.2% | 3.1% | 0.0% | 2.0% | 2.1% |
| Puerto Rico | 3,583,073 | 69.7% | 8.4% | 0.3% | 0.3% | 0.0% | 12.0% | 9.3% |
| Rhode Island | 1,053,661 | 81.1% | 6.5% | 0.5% | 3.2% | 0.0% | 5.8% | 2.8% |
| South Carolina | 4,777,576 | 67.2% | 27.5% | 0.3% | 1.4% | 0.1% | 1.5% | 2.0% |
| South Dakota | 843,190 | 85.0% | 1.6% | 8.6% | 1.2% | 0.0% | 0.9% | 2.6% |
| Tennessee | 6,499,615 | 77.8% | 16.8% | 0.3% | 1.6% | 0.1% | 1.5% | 2.0% |
| Texas | 26,538,614 | 74.9% | 11.9% | 0.5% | 4.2% | 0.1% | 6.0% | 2.5% |
| Utah | 2,903,379 | 87.6% | 1.1% | 1.1% | 2.2% | 0.9% | 4.5% | 2.6% |
| Vermont | 626,604 | 94.9% | 1.1% | 0.3% | 1.4% | 0.0% | 0.3% | 1.9% |
| Virginia | 8,256,630 | 69.0% | 19.2% | 0.3% | 6.0% | 0.1% | 2.2% | 3.2% |
| Washington | 6,985,464 | 77.8% | 3.6% | 1.3% | 7.7% | 0.6% | 3.8% | 5.2% |
| West Virginia | 1,851,420 | 93.6% | 3.3% | 0.2% | 0.7% | 0.0% | 0.2% | 2.0% |
| Wisconsin | 5,742,117 | 86.5% | 6.3% | 0.9% | 2.5% | 0.0% | 1.7% | 2.1% |
| Wyoming | 579,679 | 91.0% | 1.1% | 2.2% | 0.9% | 0.1% | 2.1% | 2.7% |
| State or territory | Population (2022 est.) |
White (Non Hispanic) | Black or African American (Non Hispanic) |
American Indian and Alaska Native (Non Hispanic) |
Asian (Non Hispanic) | Native Hawaiian and Other Pacific Islander (Non Hispanic) |
Some other race (Non Hispanic) | Two or more races (Non Hispanic) | Hispanic or Latino |
|---|---|---|---|---|---|---|---|---|---|
| Alabama | 5,074,296 | 64.1% | 25.6% | 0.3% | 1.5% | 0.0% | 0.4% | 3.3% | 4.9% |
| Alaska | 733,583 | 57.4% | 2.8% | 12.7% | 6.1% | 2.0% | 0.5% | 10.7% | 7.7% |
| Arizona | 7,359,197 | 51.8% | 4.4% | 3.3% | 3.5% | 0.2% | 0.5% | 3.9% | 32.5% |
| Arkansas | 3,045,637 | 67.5% | 14.3% | 0.4% | 1.6% | 0.5% | 0.4% | 7.0% | 8.4% |
| California | 39,029,344 | 33.7% | 5.2% | 0.3% | 15.3% | 0.3% | 0.6% | 4.3% | 40.3% |
| Colorado | 5,839,926 | 65.0% | 3.8% | 0.4% | 3.1% | 0.1% | 0.5% | 4.6% | 22.5% |
| Connecticut | 3,626,205 | 62.0% | 9.8% | 0.1% | 4.8% | 0.0% | 0.8% | 4.4% | 18.2% |
| Delaware | 1,018,396 | 58.9% | 21.6% | 0.1% | 4.1% | 0.0% | 0.5% | 4.5% | 10.3% |
| District of Columbia | 671,803 | 36.7% | 41.7% | 0.2% | 4.1% | 0.1% | 0.6% | 5.0% | 11.7% |
| Florida | 22,244,824 | 50.8% | 14.6% | 0.1% | 2.8% | 0.0% | 0.7% | 3.9% | 27.1% |
| Georgia | 10,912,876 | 49.6% | 30.7% | 0.1% | 4.4% | 0.1% | 0.5% | 4.2% | 10.4% |
| Hawaii | 1,440,196 | 20.7% | 1.6% | 0.1% | 34.6% | 9.3% | 0.4% | 22.1% | 11.1% |
| Idaho | 1,939,033 | 79.0% | 0.6% | 0.8% | 1.3% | 0.2% | 0.5% | 4.2% | 13.5% |
| Illinois | 12,582,032 | 58.5% | 13.2% | 0.1% | 5.9% | 0.0% | 0.4% | 3.6% | 18.3% |
| Indiana | 6,833,037 | 76.0% | 9.2% | 0.1% | 2.5% | 0.0% | 0.5% | 3.9% | 7.8% |
| Iowa | 3,200,517 | 82.8% | 3.7% | 0.2% | 2.3% | 0.3% | 0.3% | 3.6% | 6.8% |
| Kansas | 2,937,150 | 73.1% | 5.0% | 0.4% | 2.9% | 0.1% | 0.5% | 4.9% | 13.0% |
| Kentucky | 4,512,310 | 82.2% | 7.6% | 0.1% | 1.4% | 0.1% | 0.3% | 4.2% | 4.2% |
| Louisiana | 4,590,241 | 56.7% | 30.9% | 0.4% | 1.8% | 0.0% | 0.4% | 4.0% | 5.7% |
| Maine | 1,385,340 | 90.2% | 1.6% | 0.4% | 1.2% | 0.0% | 0.4% | 4.2% | 2.1% |
| Maryland | 6,164,660 | 47.1% | 29.2% | 0.1% | 6.5% | 0.0% | 0.8% | 4.7% | 11.4% |
| Massachusetts | 6,981,974 | 67.0% | 6.6% | 0.1% | 7.2% | 0.0% | 1.2% | 4.9% | 13.0% |
| Michigan | 10,034,118 | 72.6% | 13.1% | 0.3% | 3.3% | 0.0% | 0.5% | 4.5% | 5.7% |
| Minnesota | 5,717,184 | 76.2% | 6.9% | 0.7% | 5.2% | 0.0% | 0.6% | 4.5% | 5.8% |
| Mississippi | 2,940,057 | 55.3% | 36.5% | 0.4% | 0.9% | 0.0% | 0.3% | 3.3% | 3.3% |
| Missouri | 6,177,957 | 76.6% | 10.6% | 0.2% | 2.1% | 0.1% | 0.4% | 5.1% | 4.7% |
| Montana | 1,122,867 | 83.5% | 0.3% | 5.2% | 0.7% | 0.1% | 0.8% | 4.9% | 4.4% |
| Nebraska | 1,967,923 | 75.8% | 4.5% | 0.5% | 2.5% | 0.1% | 0.4% | 3.9% | 12.3% |
| Nevada | 3,177,772 | 44.4% | 9.0% | 0.6% | 8.8% | 0.6% | 0.6% | 5.7% | 30.3% |
| New Hampshire | 1,395,231 | 86.6% | 1.3% | 0.1% | 2.6% | 0.1% | 0.5% | 4.4% | 4.5% |
| New Jersey | 9,261,699 | 51.5% | 12.0% | 0.1% | 10.0% | 0.0% | 1.0% | 3.6% | 21.9% |
| New Mexico | 2,113,344 | 34.8% | 1.7% | 8.1% | 1.7% | 0.0% | 0.4% | 3.1% | 50.2% |
| New York | 19,677,152 | 52.9% | 13.4% | 0.2% | 9.0% | 0.0% | 1.1% | 3.7% | 19.7% |
| North Carolina | 10,698,973 | 60.7% | 20.1% | 0.9% | 3.2% | 0.1% | 0.5% | 4.1% | 10.4% |
| North Dakota | 779,261 | 82.0% | 3.3% | 4.3% | 1.6% | 0.4% | 0.4% | 3.7% | 4.4% |
| Ohio | 11,756,058 | 76.1% | 11.9% | 0.1% | 2.5% | 0.0% | 0.4% | 4.5% | 4.4% |
| Oklahoma | 4,019,800 | 62.6% | 6.7% | 6.8% | 2.3% | 0.1% | 0.3% | 9.1% | 12.1% |
| Oregon | 4,240,137 | 71.6% | 1.8% | 0.7% | 4.5% | 0.4% | 0.6% | 6.0% | 14.4% |
| Pennsylvania | 12,972,008 | 73.1% | 10.1% | 0.1% | 3.8% | 0.0% | 0.5% | 3.8% | 8.6% |
| Puerto Rico | 3,221,789 | 0.6% | 0.1% | 0.0% | 0.1% | 0% | 0.1% | 0.1% | 99.0% |
| Rhode Island | 1,093,734 | 68.2% | 4.7% | 0.1% | 3.4% | 0.0% | 0.9% | 5.2% | 17.6% |
| South Carolina | 5,282,634 | 62.5% | 24.9% | 0.2% | 1.7% | 0.0% | 0.6% | 3.6% | 6.5% |
| South Dakota | 909,824 | 79.9% | 2.0% | 7.1% | 1.4% | 0.1% | 0.3% | 4.5% | 4.7% |
| Tennessee | 7,051,339 | 71.9% | 15.5% | 0.1% | 1.9% | 0.1% | 0.4% | 4.0% | 6.3% |
| Texas | 30,029,572 | 38.9% | 11.7% | 0.2% | 5.4% | 0.1% | 0.4% | 3.2% | 40.2% |
| Utah | 3,380,800 | 75.6% | 1.0% | 0.7% | 2.4% | 1.1% | 0.4% | 3.5% | 15.1% |
| Vermont | 647,064 | 90.2% | 1.0% | 0.2% | 1.8% | 0.0% | 0.4% | 4.2% | 2.3% |
| Virginia | 8,683,619 | 58.7% | 18.4% | 0.1% | 6.9% | 0.1% | 0.7% | 4.7% | 10.4% |
| Washington | 7,785,786 | 63.5% | 3.8% | 0.9% | 9.7% | 0.7% | 0.7% | 6.7% | 14.0% |
| West Virginia | 1,775,156 | 89.8% | 3.3% | 0.1% | 0.7% | 0.0% | 0.3% | 3.8% | 1.9% |
| Wisconsin | 5,892,539 | 79.0% | 5.9% | 0.6% | 2.9% | 0.0% | 0.3% | 3.7% | 7.6% |
| Wyoming | 581,381 | 81.4% | 0.7% | 1.6% | 0.6% | 0.1% | 0.9% | 3.9% | 10.8% |
| Territory | Population (2010 est.) |
White | Black or African American |
American Indian and Alaska Native |
Asian | Native Hawaiian and Other Pacific Islander |
Some other race | Two or more races |
|---|---|---|---|---|---|---|---|---|
| American Samoa | 55,519 | 0.9% | 0.0% | — | 3.6% | 92.6% | 0.1% | 2.7% |
| Guam | 159,358 | 7.1% | 1.0% | — | 32.2% | 49.3% | 0.3% | 9.4% |
| Northern Mariana Islands | 53,883 | 2.1% | 0.1% | — | 49.9% | 34.9% | 0.2% | 12.7% |
| U.S. Virgin Islands | 106,405 | 15.6% | 76.0% | — | 1.4% | 0.0% | 4.9% | 2.1% |
| Year | White Alone | Black Alone | Hispanic | Native American Alone | Asian Alone | Pacific Islander Alone |
|---|---|---|---|---|---|---|
| 2018 | 51.6% | 14.6% | 23.4% | 0.8% | 6.4% | 0.3% |
| Year | White | Black or African American |
Hispanic | Asian | Pacific Islander | American Indian Alaska Native |
Two or more races |
|---|---|---|---|---|---|---|---|
| 2000 | 60% | 15% | 16% | 3% | — | 1% | 2% |
| 2017 | 51% | 14% | 25% | 5% | — | 1% | 4% |
| Year | White | Black or African American |
Hispanic | Asian | Pacific Islander | American Indian Alaska Native |
Two or more races |
|---|---|---|---|---|---|---|---|
| 2000 | 62% | 14% | 18% | 4% | — | 1% | 1% |
| 2017 | 54% | 14% | 22% | 6% | — | 1% | 3% |
| Age group | 85+ | 80–84 | 75–79 | 70–74 | 65–69 | 60–64 | 55–59 | 50–54 | 45–49 | 40–44 | 35–39 | 30–34 | 25–29 | 20–24 | 15–19 | 10–14 | 5–9 | <5 |
|---|---|---|---|---|---|---|---|---|---|---|---|---|---|---|---|---|---|---|
| non-Hispanic white | 83% | 81% | 79% | 78% | 77% | 74% | 72% | 69% | 65% | 61% | 58% | 57% | 57% | 56% | 55% | 54% | 52% | 50% |
| Minority | 17% | 19% | 21% | 22% | 23% | 26% | 28% | 31% | 35% | 39% | 42% | 43% | 43% | 44% | 45% | 46% | 48% | 50% |
Hispanic or Latino origin

The U.S. Office of Management and Budget (OMB) defines "Hispanic or Latino" as a person of Cuban, Mexican, Puerto Rican, Dominican, South or Central American, or other Spanish culture or origin regardless of race. People who identify with the terms "Hispanic" or "Latino" are those who classify themselves in one of the specific Hispanic or Latino categories listed on the decennial census questionnaire and various Census Bureau survey questionnaires – "Mexican, Mexican Am., Chicano" or "Puerto Rican" or "Cuban" – as well as those who indicate that they are "another Hispanic, Latino, or Spanish origin."193 People who identify their origin as Hispanic or Latino may be of any race.174
| Hispanic or Latino and Race | Population (2022 est.) | Percentage of total population |
|---|---|---|
| United States population | 333,287,550 | 100% |
| Hispanic or Latino (of any race) | 63,553,640 | 19.1% |
| White | 10,735,941 | 3.2% |
| Black or African American | 1,020,695 | 0.3% |
| American Indian and Alaska Native | 1,454,842 | 0.4% |
| Asian | 181,231 | 0.1% |
| Native Hawaiian and Other Pacific Islander | 75,468 | 0.0% |
| Some other race | 22,531,802 | 6.8% |
| Two or more races | 27,453,162 | 8.2% |
| Not Hispanic or Latino | 269,733,920 | 80.9% |
- Population distribution by Hispanic origin 1970–2020 (in %)
Source: U.S. Census Bureau, decennial census of population, 1970 (5-percent sample), 1980 to 2020.72
| Years | 1970 | 1980 | 1990 | 2000 | 2010 | 2020 |
|---|---|---|---|---|---|---|
| Not Hispanic or Latino | 95.5 | 93.6 | 91.0 | 87.5 | 83.7 | 81.3 |
| Hispanic or Latino | 4.5 | 6.4 | 9.0 | 12.5 | 16.3 | 18.7 |
| Total (%) | 100 | 100 | 100 | 100 | 100 | 100 |
- Median age of each race alone, 2021 (Hispanic)
Source: United States Census Bureau.181
| Race | Median age (both sex) (years) | Median age (male) (years) | Median age (female) (years) |
|---|---|---|---|
| Total (Hispanic) | 30.5 | 30.2 | 30.8 |
| White | 31.2 | 30.9 | 31.5 |
| Black or African American | 27.1 | 26.1 | 28.2 |
| American Indian and Alaska Native | 28.4 | 29.0 | 27.8 |
| Asian | 26.9 | 26.2 | 27.7 |
| Native Hawaiian and Other Pacific Islander | 27.8 | 28.3 | 27.2 |
| Two or More Races | 21.5 | 21.1 | 22.0 |
- Median age of each race alone or in combination, 2021 (Hispanic)
Source: United States Census Bureau.181
| Race | Median age (both sex) (years) | Median age (male) (years) | Median age (female) (years) |
|---|---|---|---|
| White | 30.9 | 30.6 | 31.1 |
| Black or African American | 25.3 | 24.3 | 26.3 |
| American Indian and Alaska Native | 27.6 | 27.8 | 27.3 |
| Asian | 23.0 | 22.3 | 23.7 |
| Native Hawaiian and Other Pacific Islander | 24.8 | 24.9 | 24.7 |
Note: Hispanic origin is considered an ethnicity, not a race. Hispanics may be of any race.
Indigenous peoples
As of 2020, there are 9,666,058 people identifying as American Indian and Alaska Native people in the United States, including those identifying with more than one race,194 representing around 3% of the U.S. population. This number includes not only groups indigenous to the United States, but any Indigenous people of the Americas,195 including Mesoamerican peoples such as the Maya, as well as Canadian and South American natives. In 2022, 634,503 Indigenous people in the United States identified with Central American Indigenous groups, 875,183 identified with the Indigenous people of Mexico, and 47,518 identified with Canadian First Nations.196 Of the 3.2 million Americans who identified as American Indian or Alaska Native alone in 2022, around 45% were of Hispanic or Latino ethnicity,197198 with this number growing as increasing numbers of Indigenous people from Latin American countries immigrate to the U.S. and more Latinos self-identify with indigenous heritage. Of groups Indigenous to the contiguous United States, the largest self-reported tribes are Cherokee (1,449,888), Navajo (434,910), Choctaw (295,373), Blackfeet (288,255), and Sioux (220,739). Additionally, 205,954 identify with an Alaska Native tribe. There are 573 federally recognized tribal governments199 in the United States.200
The U.S. Census Bureau classifies Native Hawaiians separately from American Indians and Alaska Natives, grouping them with Pacific Islanders instead. According to 2022 estimates, 714,847 Americans identified with Native Hawaiian ancestry.201
Other groups
Veterans
There were 15.8 million veterans in 2023,202 with 6.2% of Americans having served in the Armed Forces.203 In 2023 the war with the highest number of veterans was the Korean War. Most veterans were male at 14 million and 1.7 million veterans were female.202 Currently the veteran population in the United States is getting smaller but more diverse. The racial makeup of veterans was in 2023 as follows: 74.1% white, 12.6% African-American, 10.3% other/mixed-race, 2.2% Asian/Native Hawaiian/Pacific Islander and 0.8% being Native American.204 Veterans have a lower poverty and unemployment than non-veterans but have higher rates of disability than non-veterans.205
Illegal immigrants
In 2010, The Washington Post estimated that there were 11 million illegal immigrants in the country.206 In 2017, the Pew Research Center reported an estimated 10.5 million illegal immigrants in the U.S.207 In 2025, Pew announced that "the number of unauthorized immigrants in the United States reached an all-time high of 14 million in 2023 after two consecutive years of growth".208
Prisoners
In 2023, an estimated 1,850,595 adults were imprisoned in the United States.209
In 2016 it was reported that 92.7% of all prisoners were male, 6.9% female, 0.3% transgender, and 0.1% nonbinary.210 In 2022, there were 180,684 women incarcerated in U.S. prisons and jails. Most women involved in the country's correctional system were actually under probation, with 717,811 being so classified. Female parolees numbered 76,870, while 87,874 women were held in prisons and 92,900 women were held in jails in 2022.211
Some 37% of all federal prisoners were Hispanic, 32% Black/African American, 21% white, and 2% Native American or Alaska Native. Asians, Native Hawaiians and other Pacific islanders made up 2% of the population, while "nearly 7% of federal prisoners identified as two or more races". In state prisons, 34% identified as Black/African American, 32% white, 21% Hispanic, 1% Native American or Alaskan Native, 1% as being either Asian/Native Hawaiian/Other Pacific Islander, and 11% "identified with two or more races".210
LGBTQ Population
The United States Census Bureau does not measure sexual orientation but plans are in place to start measuring it starting in 2027 with the American Community Survey.212 In 2024, Gallup reported that 9.3% of adults were LGBTQ. The percentage of people who have reported being LGBTQ has risen during the 2010s and 2020s. Of LGBTQ adults in the United States, the most common identification was bisexual, with 56.3% of LGBTQ adults identifying as bisexual; bisexual people made up 5.2% of the adult U.S. population. The survey also reported that 13.9% of LGBTQ adults were transgender and made up 1.3% of the U.S. adult population.213
In the 2020 United States Census, there were more reported same-sex married couples than unmarried ones as there were 668,497 married same-sex couples and 500,073 unmarried same-sex couples.214
In June 2023, UCLA's Williams Institute reported that there were approximately 823,000 same-sex couples in the United States. Also according to the institute, most same-sex couples were female at 53% and males were 47% of same-sex couples.215
Projections
| 2023 | 2060 | |
|---|---|---|
| White Americans1 | 75.5% | 72.3% |
| > Non-Hispanic Whites | 58.9% | 44.9% |
| Black Americans1 | 13.6% | 14.8% |
| Asian Americans1 | 6.3% | 9.4% |
| Multiracial Americans1 | 3.0% | 6.1% |
| Native Americans1 | 1.3% | 1.4% |
| Pacific Islanders1 | 0.3% | 0.4% |
| Hispanics/Latinos (of any race) | 19.1% | 26.9% |
| 1 Including Hispanics | ||
A report by the U.S. Census Bureau projects a decrease in the ratio of non-Hispanic Whites between 2023 and 2060, a decline from 58.9% of the population to 44.9%. Non-Hispanic Whites are projected to no longer make up a majority of the population by 2050, but will remain the largest single ethnic group. Non-Hispanic whites made up 85% of the population in 1960.217
While non-Hispanic whites are projected to become a minority, the total White population (including Hispanics), will remain a majority from 2023 to 2060, falling from 75.5% to 72.3% of the population who are white alone according to the projections.218 However, these projections are not directly comparable to other Census Bureau data, as they are based on a modified race dataset,219 which does not include the "some other race" category used in census surveys.220 Individuals identifying as “some other race” alone or in combination made up 16.2% of the population in 2022,221 and they are reclassified into recognized race categories in the dataset used for the projections.222 As a result, there is a significant discrepancy between the share of the white alone population in 2023 according to the projections (75.5%), and the estimated share of white alone (60.9%), as reported by the American Community Survey in 2022.223
The report foresees the Hispanic or Latino population rising from 19.1% today to 26.9% by 2060, the Black percentage barely rising from 13.6% to 14.8%, and Asian Americans upping their 6.3% share to 9.4%. The United States had a population of 333 million people in July 2023, and is projected to reach 355 million by 2040 and 364 million in 2060.224225226227228 It is further projected that all of the increase in population from 2023 to 2060 will be due to immigrants.
Of the nation's children in 2060, 64% are expected to be of a minority ethnicity, up from 51% today. Approximately 32% are projected to be Hispanic or Latino (up from 26% in 2023), and 36% are projected to be single-race, non-Hispanic Whites (down from 49% in 2023). Racial and ethnic minorities surpassed non-Hispanic whites as the largest group of U.S. children under 5 years old in 2015.229
The fastest growing racial group in America is Asian Americans with a growth rate of 35%, however the multiracial mixed Asian group is growing even faster, with a growth rate of 55%. Multiracial Asians are therefore the fastest growing demographic group in America.4039
In 2020, it was reported that 51.0% of births were to non-Hispanic white mothers.132 In 2021, the percentage increased to 51.5%.132230 However, by 2022 the rate of births to white mothers had declined by 3%, dropping to 50% of all total births. In the same period, the rate of births to Asian and Hispanic women increased by 2% and 6%, respectively.231232
- Population pyramids of racial groups (of one race)
-
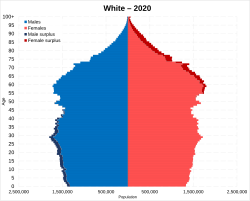
-
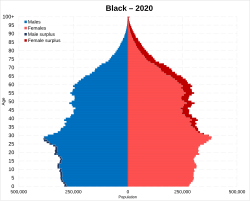
-

-
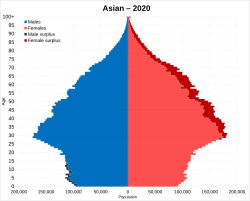
-
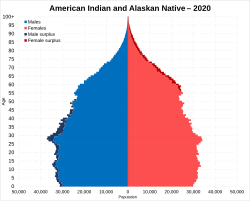
- Population pyramids of ethnic groups
-

-
 Non-Hispanic African Americans
 -

- Pew Research Center projections
The United Nations projects a population of just over 400 million in 2060.
| 1960 | 2005 | 2050 | |
|---|---|---|---|
| White Americans | 85% | 67% | 47% |
| Hispanic Americans | 3.5% | 14% | 29% |
| Black Americans | 11% | 13% | 14% |
| Asian Americans | 0.6% | 5% | 9% |
| Note: All races modified and not Hispanic; American Indian/Alaska Native not shown. | |||
The country's racial profile will be vastly different, and although whites will remain the single largest ethnic group in the U.S., they will no longer be a majority excluding White Hispanics by 2055 according to Pew Research Center. Growth in the Hispanic and Asian populations is predicted to almost triple over the next 40 years. By 2055, the breakdown is estimated to be 48% non-Hispanic white, 24% Hispanic, 16% Black, and 14% Asian.234
As of 2015, 14% of the United States' population is foreign born, compared to just 5% in 1965. Nearly 39 million immigrants have come to the U.S. since 1965, with most coming from Asia and Latin America. The 2015 Census Report predicts that the percentage of the U.S. population that is foreign-born will continue to increase, reaching 19% by 2060. This increase in the foreign-born population will account for a large share of the overall population growth.234
The average person in the U.S. of 2060 is likely to be older than the average person of 2018 today, and it is projected that almost one in four people will be 65 or older.234
U.S. Census Census Bureau projections
- Percent minority 1970–2042 (2008 projections)
- 72
| Years | 1970 | 1980 | 1990 | 2000 | 2010 | 2020 | 2030 | 2040 | 2042 |
|---|---|---|---|---|---|---|---|---|---|
| Percent minority (%) | 16.5 | 20.4 | 24.4 | 30.9 | 36.3 | 39.9 | 44.5 | 49.2 | 50.1 |
Note: "Minority" refers to people who reported their ethnicity and race as something other than non-Hispanic White alone in the decennial census.
- Total US population
| Year | Projection (Census Bureau)225
(thousands) |
Projection (UN)235
(thousands) |
Actual result |
|---|---|---|---|
| 2010 | 310,233 | 309,011 | 308,745,538 |
| 2020 | 332,639 | 331,003 | 331,449,281 |
| 2030 | 373,504 | 349,642 | |
| 2040 | 405,655 | 366,572 | |
| 2050 | 439,010 | 379,419 |
Self-reported ancestry

This table displays all self-reported ancestries with over 50,000 members, alone or in combination, according to estimates from the 2022 American Community Survey. The total population of the US according to the survey was 333,287,550, and 251,732,240 people reported an ancestry. Of these, 175,054,020 reported a single ancestry, and 76,678,224 reported two or more ancestries.236 Hispanic groups are not distinguished between total and partial ancestry:
| Ancestry237238239240 | Number in 2022 (Alone)241 | Number as of 2022 (Alone or in any combination) | % Total |
|---|---|---|---|
| Black or African American
(Including Afro-Caribbean and sub-Saharan African) |
40,603,656 | 47,859,760 | 14.4% |
| German | 13,241,923 | 41,137,168 | 12.3% |
| Mexican | — | 37,414,772 | 11.2% |
| English | 12,331,696 | 31,380,620 | 9.4% |
| Irish | 8,649,243 | 30,655,612 | 9.2% |
| American
(Mostly old-stock white Americans of British descent) |
14,929,899 | 17,786,214 | 5.3% |
| Italian | 5,766,634 | 16,009,774 | 4.8% |
| Polish | 2,658,632 | 8,249,491 | 2.5% |
| French
(Not including French Canadian) |
1,360,631 | 6,310,548 | 1.9% |
| Puerto Rican | — | 5,905,178 | 1.8% |
| Chinese
(Not including Taiwanese) |
4,258,198 | 5,465,428 | 1.6% |
| Scottish | 1,555,579 | 5,352,344 | 1.6% |
| Indian | 4,534,339 | 4,946,306 | 1.5% |
| Broadly "European"
(No country specified) |
3,718,055 | 4,819,541 | 1.4% |
| Filipino | 2,969,978 | 4,466,918 | 1.3% |
| Swedish | 740,478 | 3,936,772 | 1.2% |
| Norwegian | 1,224,373 | 3,317,462 | 1.0% |
| Dutch | 858,809 | 3,019,465 | 0.9% |
| Indigenous American
(No tribe specified) |
493,837 | 2,550,528 | 0.8% |
| Scotch-Irish | 940,337 | 2,524,746 | 0.8% |
| Salvadoran | — | 2,480,509 | 0.7% |
| Cuban | — | 2,435,573 | 0.7% |
| Dominican | — | 2,396,784 | 0.7% |
| Vietnamese | 1,887,550 | 2,301,868 | 0.7% |
| Other Hispanic or Latino
(Including Hispano, Californio, Tejano, Isleño, and unspecified Hispanic origins) |
— | 2,276,867 | 0.7% |
| Arab
(Including Lebanese (583,719), Egyptian (334,574), Syrian (203,282), Palestinian (171,969), Iraqi (164,851), Moroccan (140,196), Jordanian (86,926), and all other Arab ancestries) |
1,502,360 | 2,237,982 | 0.7% |
| Russian | 747,866 | 2,099,079 | 0.6% |
| Korean | 1,501,587 | 2,051,572 | 0.6% |
| Spanish
(Including responses of "Spaniard," "Spanish," and "Spanish American." Many Hispanos of New Mexico identify as Spanish/Spaniard) |
— | 1,926,228 | 0.6% |
| Guatemalan | — | 1,878,599 | 0.6% |
| Broadly “African”
(Not further specified) |
1,297,668 | 1,721,108 | 0.5% |
| French Canadian | 694,089 | 1,626,456 | 0.5% |
| Japanese | 717,413 | 1,587,040 | 0.5% |
| Welsh | 293,551 | 1,521,565 | 0.5% |
| Colombian | — | 1,451,271 | 0.4% |
| Cherokee | 239,224 | 1,449,888 | 0.4% |
| Portuguese | 543,531 | 1,350,442 | 0.4% |
| Hungarian | 390,561 | 1,247,165 | 0.4% |
| Jamaican | 903,516 | 1,234,336 | 0.4% |
| Honduran | — | 1,219,212 | 0.4% |
| Greek | 486,878 | 1,200,706 | 0.4% |
| Broadly “British”
(Not further specified) |
503,077 | 1,196,265 | 0.4% |
| Czech | 340,768 | 1,188,711 | 0.4% |
| Ukrainian | 565,431 | 1,164,728 | 0.3% |
| Haitian | 937,373 | 1,138,855 | 0.3% |
| Danish | 268,019 | 1,127,518 | 0.3% |
| Broadly "Eastern European"
(Not further specified) |
566,715 | 951,384 | 0.3% |
| Broadly "Scandinavian"
(Not further specified) |
372,673 | 935,153 | 0.3% |
| Indigenous Mexican | 548,717 | 875,183 | 0.3% |
| Ecuadorian | — | 870,965 | 0.3% |
| Swiss | 196,120 | 847,247 | 0.3% |
| Venezuelan | — | 814,080 | 0.2% |
| Peruvian | — | 751,519 | 0.2% |
| Native Hawaiian | 185,466 | 714,847 | 0.2% |
| Nigerian | 532,438 | 712,294 | 0.2% |
| Indigenous Central American
(Mayan, etc) |
315,313 | 634,503 | 0.2% |
| Pakistani | 560,494 | 625,570 | 0.2% |
| Finnish | 189,603 | 606,028 | 0.2% |
| Slovak | 186,902 | 602,949 | 0.2% |
| Lithuanian | 167,355 | 598,508 | 0.2% |
| Broadly "Asian"
(Not further specified) |
218,730 | 591,806 | 0.2% |
| Austrian | 123,987 | 584,517 | 0.2% |
| Brazilian | 389,082 | 546,757 | 0.2% |
| Canadian | 249,309 | 542,459 | 0.2% |
| Iranian | 392,051 | 519,658 | 0.2% |
| Nicaraguan | — | 488,080 | 0.1% |
| Armenian | 282,012 | 458,841 | 0.1% |
| Other sub-Saharan African
All sub-Saharan African origins other those already listed + Ugandan (35,849), Senegalese (31,462), and Zimbabwean (17,991) |
325,963 | 452,003 | 0.1% |
| Romanian | 251,069 | 450,751 | 0.1% |
| Navajo | 328,434 | 434,910 | 0.1% |
| Broadly "Northern European"
(No country specified) |
273,675 | 434,292 | 0.1% |
| Croatian | 128,623 | 389,272 | 0.1% |
| Ethiopian | 348,332 | 387,880 | 0.1% |
| Cambodian | 280,862 | 376,096 | 0.1% |
| Hmong | 335,612 | 362,244 | 0.1% |
| Thai | 197,158 | 328,176 | 0.1% |
| Taiwanese | 263,772 | 324,389 | 0.1% |
| Belgian | 96,361 | 316,493 | 0.1% |
| Argentine | — | 304,541 | 0.09% |
| Choctaw | 90,321 | 295,373 | 0.09% |
| Bangladeshi | 256,681 | 272,338 | 0.08% |
| Central Asian | 186,393 | 269,255 | 0.08% |
| Samoan | 123,150 | 264,392 | 0.08% |
| Nepali | 247,639 | 260,323 | 0.08% |
| Other Pacific Islander
(Pacific Islander origin without a specified Melanesian, Polynesian, or Micronesian group) |
43,135 | 251,806 | 0.08% |
| Guyanese | 182,088 | 250,467 | 0.08% |
| Broadly "West Indian"
(No country specified) |
130,229 | 245,867 | 0.07% |
| Laotian | 173,524 | 245,220 | 0.07% |
| Burmese | 225,591 | 244,086 | 0.07% |
| Trinidadian | 167,746 | 243,541 | 0.07% |
| Panamanian | — | 242,035 | 0.07% |
| Turkish | 168,354 | 239,667 | 0.07% |
| Pennsylvania German | 155,563 | 228,634 | 0.07% |
| "Czechoslovaks"
(Not further specified) |
79,992 | 227,217 | 0.07% |
| Albanian | 182,625 | 223,984 | 0.07% |
| Sioux | 100,575 | 220,739 | 0.07% |
| Ghanaian | 179,527 | 217,322 | 0.07% |
| Chippewa/Ojibwe | 87,888 | 206,224 | 0.06% |
| Alaska Native
(Including all tribes) |
107,877 | 205,954 | 0.06% |
| Chilean | — | 199,948 | 0.06% |
| "Yugoslavian"
(Not further specified) |
129,759 | 198,687 | 0.06% |
| Apache | 73,085 | 191,823 | 0.06% |
| Serbian | 96,388 | 191,538 | 0.06% |
| Afghan | 169,255 | 189,493 | 0.06% |
| Costa Rican | — | 186,159 | 0.06% |
| Somali | 151,206 | 164,723 | 0.05% |
| Indonesian | 84,074 | 155,173 | 0.05% |
| Slovene | 48,809 | 153,589 | 0.05% |
| Chamorro
(10,194 additionally reported their ancestry as "Guamanian" alone, and 25,888 reported "Guamanian" alone or in combination) |
74,138 | 152,006 | 0.05% |
| Israeli | 80,336 | 144,202 | 0.04% |
| Bolivian | — | 142,108 | 0.04% |
| Broadly "Slavic"
(No country specified) |
57,491 | 140,956 | 0.04% |
| Kenyan | 98,938 | 122,131 | 0.04% |
| Creek/Muscogee | 36,446 | 119,850 | 0.04% |
| "British West Indian"
(No country/territory specified) |
74,833 | 109,344 | 0.03% |
| Iroqouis | 30,095 | 107,839 | 0.03% |
| Bulgarian | 75,386 | 106,896 | 0.03% |
| Cape Verdean | 71,306 | 104,710 | 0.03% |
| South African | 64,890 | 98,309 | 0.03% |
| Assyrian | 64,349 | 93,542 | 0.03% |
| Liberian | 76,087 | 92,651 | 0.03% |
| Latvian | 33,742 | 91,859 | 0.03% |
| Cajun | 59,046 | 91,706 | 0.03% |
| Indigenous South American | 28,813 | 91,508 | 0.03% |
| Australian | 37,180 | 88,999 | 0.03% |
| Lumbee | 58,226 | 81,645 | 0.02% |
| Pueblo | 49,201 | 81,419 | 0.02% |
| Other Micronesian
(All Micronesian groups other than Chamorro/Guamanian, Chuukese (12,567), or Marshallese) |
62,829 | 79,879 | 0.02% |
| Tongan | 41,530 | 79,826 | 0.02% |
| Uruguayan | — | 77,180 | 0.02% |
| Sri Lankan | 58,210 | 75,808 | 0.02% |
| Chickasaw | 23,670 | 72,601 | 0.02% |
| Sudanese | 64,586 | 71,788 | 0.02% |
| Yaqui | 35,442 | 71,063 | 0.02% |
| Belizean | 42,028 | 67,329 | 0.02% |
| Macedonian | 39,586 | 65,107 | 0.02% |
| Basque | 24,219 | 62,731 | 0.02% |
| Barbadian | 37,974 | 62,356 | 0.02% |
| Bahamian | 31,777 | 56,928 | 0.02% |
| Icelandic | 18,978 | 53,415 | 0.02% |
| Fijian | 35,788 | 53,250 | 0.02% |
| Uzbek | 25,849 | 52,304 | 0.02% |
| Mongolian | — | 51,954 | 0.02% |
| Marshallese | 43,548 | 51,119 | 0.02% |
Religion
Religious affiliations
Religion in the United States (2023)242
- Protestantism (39.0%)
- Catholicism (19.0%)
- Mormon (2.00%)
- Other Christian (2.00%)
- Jewish (2.00%)
- Muslim (1.00%)
- Buddhist (1.00%)
- Hindu (1.00%)
- Other religion (3.00%)
- Unaffiliated (29.0%)
- Refused (1.00%)
The table below is based mainly on selected data as reported to the United States Census Bureau. It only includes the voluntary self-reported membership of religious bodies with 750,000 or more. The definition of a member is determined by each religious body.243 In 2004, the US census bureau reported that about 13% of the population did not identify themselves as a member of any religion.244
According to data from Pew Research, Americans are significantly more religious on average than populations in other developed Western nations, with 55% of Americans reporting praying daily, compared to only 25% of Canadians, 18% of Australians, 6% of British people, and 22% of Europeans as a whole.245 The country has a smaller share of unaffiliated or atheist population than most other Western nations. However, this population has been growing significantly in recent decades. Surveys conducted in 2014 and 2019 by Pew indicated that the percentage of Americans unaffiliated with a religion increased from 16% in 2007 to 23% in 2014 and 26% of the population in 2019.246247 A Pew Research Survey performed in 2012 found that the number of Americans without a religion was approaching the number of Evangelical Protestants, and estimated that if the current growth rate in irreligion continued, around 51% of Americans will not have a religion by 2050.248
According to statistical data made by the Pew Research Center in 2023 about 62% of the US population is Christian, 29% is Unaffiliated, 2% is Jewish, 1% follows Buddhism, 1% follows Hinduism, 1% follows Islam and 3% follow traditional religions and others.249 Currently, the United States has the largest Christian population in the world (approximately 210 million) and the largest Protestant Christian population (approximately 130 million). The country also has the second largest Jewish community in the world (after Israel) and the largest Buddhist and Hindu communities in the West, as well as the largest number of followers of Islam in North America. The country has about 99 million non-affiliates (only China and Japan have more).
Chart:
-
 Religious affiliation within each state that has the largest deviation compared to the national average, 2001
 -
 Percentage of state populations that identify with a religion rather than "no religion", 2014
 -
 Plurality religion by state, 2001. Data is unavailable for Alaska and Hawaii.
According to Pew Research Center study released in 2018, by 2040, Islam will surpass Judaism to become the second largest religion in the US due to higher immigration and birth rates.275
Religions of U.S. adults
The United States government does not collect religious data in its census. The survey below, the American Religious Identification Survey (ARIS) 2008, was a random digit-dialed telephone survey of 54,461 American residential households in the contiguous United States. The 1990 sample size was 113,723; 2001 sample size was 50,281.
Adult respondents were asked the open-ended question, "What is your religion, if any?". Interviewers did not prompt or offer a suggested list of potential answers. The religion of the spouse or partner was also asked. If the initial answer was "Protestant" or "Christian" further questions were asked to probe which particular denomination. About one-third of the sample was asked more detailed demographic questions.
Religious Self-Identification of the U.S. Adult Population: 1990, 2001, 2008276
Figures are not adjusted for refusals to reply; investigators suspect refusals are possibly more representative of "no religion" than any other group.
| Group | 1990 adults × 1,000 |
2001 adults × 1,000 |
2008 adults × 1,000 |
Numerical Change 1990– 2008 as % of 1990 |
1990 % of adults |
2001 % of adults |
2008 % of adults |
change in % of total adults 1990– 2008 |
|---|---|---|---|---|---|---|---|---|
| Adult population, total | 175,440 | 207,983 | 228,182 | 30.1% | ||||
| Adult population, Responded | 171,409 | 196,683 | 216,367 | 26.2% | 97.7% | 94.6% | 94.8% | −2.9% |
| Total Christian | 151,225 | 159,514 | 173,402 | 14.7% | 86.2% | 76.7% | 76.0% | −10.2% |
| Catholic | 46,004 | 50,873 | 57,199 | 24.3% | 26.2% | 24.5% | 25.1% | −1.2% |
| Non-Catholic Christian | 105,221 | 108,641 | 116,203 | 10.4% | 60.0% | 52.2% | 50.9% | −9.0% |
| Baptist | 33,964 | 33,820 | 36,148 | 6.4% | 19.4% | 16.3% | 15.8% | −3.5% |
| Mainline Protestant | 32,784 | 35,788 | 29,375 | −10.4% | 18.7% | 17.2% | 12.9% | −5.8% |
| Methodist | 14,174 | 14,039 | 11,366 | −19.8% | 8.1% | 6.8% | 5.0% | −3.1% |
| Lutheran | 9,110 | 9,580 | 8,674 | −4.8% | 5.2% | 4.6% | 3.8% | −1.4% |
| Presbyterian | 4,985 | 5,596 | 4,723 | −5.3% | 2.8% | 2.7% | 2.1% | −0.8% |
| Episcopalian/Anglican | 3,043 | 3,451 | 2,405 | −21.0% | 1.7% | 1.7% | 1.1% | −0.7% |
| United Church of Christ | 438 | 1,378 | 736 | 68.0% | 0.2% | 0.7% | 0.3% | 0.1% |
| Christian Generic | 25,980 | 22,546 | 32,441 | 24.9% | 14.8% | 10.8% | 14.2% | −0.6% |
| Jehovah's Witness | 1,381 | 1,331 | 1,914 | 38.6% | 0.8% | 0.6% | 0.8% | 0.1% |
| Christian Unspecified | 8,073 | 14,190 | 16,384 | 102.9% | 4.6% | 6.8% | 7.2% | 2.6% |
| Non-denominational Christian | 194 | 2,489 | 8,032 | 4040.2% | 0.1% | 1.2% | 3.5% | 3.4% |
| Protestant – Unspecified | 17,214 | 4,647 | 5,187 | −69.9% | 9.8% | 2.2% | 2.3% | −7.5% |
| Evangelical/Born Again | 546 | 1,088 | 2,154 | 294.5% | 0.3% | 0.5% | 0.9% | 0.6% |
| Pentecostal/Charismatic | 5,647 | 7,831 | 7,948 | 40.7% | 3.2% | 3.8% | 3.5% | 0.3% |
| Pentecostal – Unspecified | 3,116 | 4,407 | 5,416 | 73.8% | 1.8% | 2.1% | 2.4% | 0.6% |
| Assemblies of God | 617 | 1,105 | 810 | 31.3% | 0.4% | 0.5% | 0.4% | 0.0% |
| Church of God | 590 | 943 | 663 | 12.4% | 0.3% | 0.5% | 0.3% | 0.0% |
| Other Protestant Denomination | 4,630 | 5,949 | 7,131 | 54.0% | 2.6% | 2.9% | 3.1% | 0.5% |
| Seventh-day Adventist | 668 | 724 | 938 | 40.4% | 0.4% | 0.3% | 0.4% | 0.0% |
| Churches of Christ | 1,769 | 2,593 | 1,921 | 8.6% | 1.0% | 1.2% | 0.8% | −0.2% |
| Mormon/Latter-Day Saints | 2,487 | 2,697 | 3,158 | 27.0% | 1.4% | 1.3% | 1.4% | 0.0% |
| Total non-Christian religions | 5,853 | 7,740 | 8,796 | 50.3% | 3.3% | 3.7% | 3.9% | 0.5% |
| Jewish | 3,137 | 2,837 | 2,680 | −14.6% | 1.8% | 1.4% | 1.2% | −0.6% |
| Eastern Religions | 687 | 2,020 | 1,961 | 185.4% | 0.4% | 1.0% | 0.9% | 0.5% |
| Buddhist | 404 | 1,082 | 1,189 | 194.3% | 0.2% | 0.5% | 0.5% | 0.3% |
| Muslim | 527 | 1,104 | 1,349 | 156.0% | 0.3% | 0.5% | 0.6% | 0.3% |
| New Religious Movements & Others | 1,296 | 1,770 | 2,804 | 116.4% | 0.7% | 0.9% | 1.2% | 0.5% |
| None/ No religion, total | 14,331 | 29,481 | 34,169 | 138.4% | 8.2% | 14.2% | 15.0% | 6.8% |
| Agnostic+Atheist | 1,186 | 1,893 | 3,606 | 204.0% | 0.7% | 0.9% | 1.6% | 0.9% |
| Did Not Know/ Refused to reply | 4,031 | 11,300 | 11,815 | 193.1% | 2.3% | 5.4% | 5.2% | 2.9% |
-
![States in the United States by Catholic population according to the Pew Research Center 2014 Religious Landscape Survey.[277] States with Catholic population greater than the United States as a whole are in full red.](/api/ext/img?url=https%3A%2F%2Fupload.wikimedia.org%2Fwikipedia%2Fcommons%2Fthumb%2Fc%2Fca%2FUS_states_by_Catholic_population.png%2F330px-US_states_by_Catholic_population.png) States in the United States by Catholic population according to the Pew Research Center 2014 Religious Landscape Survey.277 States with Catholic population greater than the United States as a whole are in full red.
States in the United States by Catholic population according to the Pew Research Center 2014 Religious Landscape Survey.277 States with Catholic population greater than the United States as a whole are in full red. -
![States in the United States by Evangelical Protestant population according to the Pew Research Center 2014 Religious Landscape Survey.[277] States with Evangelical Protestant populations greater than the United States as a whole are in full orange.](/api/ext/img?url=https%3A%2F%2Fupload.wikimedia.org%2Fwikipedia%2Fcommons%2Fthumb%2F7%2F7d%2FUS_states_by_Evangelical_Protestant_population.png%2F330px-US_states_by_Evangelical_Protestant_population.png) States in the United States by Evangelical Protestant population according to the Pew Research Center 2014 Religious Landscape Survey.277 States with Evangelical Protestant populations greater than the United States as a whole are in full orange.
States in the United States by Evangelical Protestant population according to the Pew Research Center 2014 Religious Landscape Survey.277 States with Evangelical Protestant populations greater than the United States as a whole are in full orange.
-
![States in the United States by Mainline or Black Protestant population according to the Pew Research Center 2014 Religious Landscape Survey.[277] States with Mainline or Black Protestant population greater than the United States as a whole are in full purple.](/api/ext/img?url=https%3A%2F%2Fupload.wikimedia.org%2Fwikipedia%2Fcommons%2Fthumb%2Ff%2Ff6%2FUS_states_by_Mainline_or_Black_Protestant_population.png%2F330px-US_states_by_Mainline_or_Black_Protestant_population.png) States in the United States by Mainline or Black Protestant population according to the Pew Research Center 2014 Religious Landscape Survey.277 States with Mainline or Black Protestant population greater than the United States as a whole are in full purple.
States in the United States by Mainline or Black Protestant population according to the Pew Research Center 2014 Religious Landscape Survey.277 States with Mainline or Black Protestant population greater than the United States as a whole are in full purple. -
![States in the United States by non-Christian (e.g. Non-religious, Jewish, Muslim, Hindu, Buddhist) population according to the Pew Research Center 2014 Religious Landscape Survey.[277] States with non-Christian populations greater than the United States as a whole are in full blue.](/api/ext/img?url=https%3A%2F%2Fupload.wikimedia.org%2Fwikipedia%2Fcommons%2Fthumb%2F5%2F53%2FUS_states_by_non-Christian_population.png%2F330px-US_states_by_non-Christian_population.png) States in the United States by non-Christian (e.g. Non-religious, Jewish, Muslim, Hindu, Buddhist) population according to the Pew Research Center 2014 Religious Landscape Survey.277 States with non-Christian populations greater than the United States as a whole are in full blue.
States in the United States by non-Christian (e.g. Non-religious, Jewish, Muslim, Hindu, Buddhist) population according to the Pew Research Center 2014 Religious Landscape Survey.277 States with non-Christian populations greater than the United States as a whole are in full blue.
-
![States in the United States by non-Protestant and non-Catholic Christian (e.g. Mormon, Jehovah's Witness, Eastern Orthodox) population according to the Pew Research Center 2014 Religious Landscape Survey.[277] States with non-Catholic/non-Protestant Christian population greater than the United States as a whole are in full green.](/api/ext/img?url=https%3A%2F%2Fupload.wikimedia.org%2Fwikipedia%2Fcommons%2Fthumb%2F5%2F55%2FUS_states_by_other_Christian_population.png%2F330px-US_states_by_other_Christian_population.png) States in the United States by non-Protestant and non-Catholic Christian (e.g. Mormon, Jehovah's Witness, Eastern Orthodox) population according to the Pew Research Center 2014 Religious Landscape Survey.277 States with non-Catholic/non-Protestant Christian population greater than the United States as a whole are in full green.
States in the United States by non-Protestant and non-Catholic Christian (e.g. Mormon, Jehovah's Witness, Eastern Orthodox) population according to the Pew Research Center 2014 Religious Landscape Survey.277 States with non-Catholic/non-Protestant Christian population greater than the United States as a whole are in full green.
Migration
Immigration
Foreign-born population


As of 2017, an estimated 44,525,458 residents of the United States were foreign-born,279 13.5% of the country's total population. This demographic includes recent as well as longstanding immigrants; statistically Europeans have resided in the US longer than those from other regions with approximately 66% having arrived prior to 2000.280
| Place of birth | Estimate | Percentage of total foreign-born people |
|---|---|---|
| Americas | 23,241,959 | 52.2% |
| Caribbean | 4,414,943 | 9.9% |
| > Cuba | 1,311,803 | 3.0% |
| > Dominican Republic | 1,162,568 | 2.6% |
| Central America (including Mexico) | 14,796,926 | 33.2% |
| > Mexico | 11,269,913 | 25.3% |
| > El Salvador | 1,401,832 | 3.2% |
| South America | 3,213,187 | 7.2% |
| Canada | 809,267 | 1.8% |
| Europe | 4,818,662 | 10.8% |
| Northern Europe | 941,796 | 2.1% |
| Western Europe | 949,591 | 2.1% |
| Southern Europe | 761,390 | 1.7% |
| Eastern Europe | 2,153,855 | 4.8% |
| Asia | 13,907,844 | 31.2% |
| Eastern Asia | 4,267,303 | 9.6% |
| > China | 2,639,365 | 5.9% |
| > Korea | 1,064,960 | 2.4% |
| South Central Asia | 4,113,013 | 9.2% |
| > India | 2,348,687 | 5.3% |
| South Eastern Asia | 4,318,647 | 9.8% |
| > Philippines | 1,945,345 | 4.4% |
| > Vietnam | 1,314,927 | 3.0% |
| Western Asia | 1,159,835 | 2.6% |
| Africa | 2,293,028 | 5.2% |
| Eastern Africa | 693,784 | 1.6% |
| Middle Africa | 163,364 | 0.4% |
| Northern Africa | 359,559 | 0.8% |
| Southern Africa | 116,297 | 0.2% |
| Western Africa | 837,290 | 1.9% |
| Oceania | 263,965 | 0.6% |
| Australia and New Zealand Subregion | 123,080 | 0.3% |
Immigration (2023)
| Immigrants in the | ||||
| Country | Immigrants | |||
|---|---|---|---|---|
| 10,918,205 | ||||
| 2,910,042 | ||||
| 2,193,250 | ||||
| 2,051,900 | ||||
| 1,494,869 | ||||
| 1,450,808 | ||||
| 1,365,841 | ||||
| 1,265,231 | ||||
| 1,250,053 | ||||
| 1,049,821 | ||||
In 2017, out of the U.S. foreign-born population, some 45% (20.7 million) were naturalized citizens, 27% (12.3 million) were lawful permanent residents (including many eligible to become citizens), 6% (2.2 million) were temporary lawful residents, and 23% (10.5 million) were unauthorized immigrants.282 The Pew Research Center estimated that "the number of unauthorized immigrants in the United States reached an all-time high of 14 million in 2023 after two consecutive years of growth".283
Among current living immigrants to the U.S., the top five countries of birth are Mexico (25% of immigrants), China (6%), India (6%), the Philippines (5%) and El Salvador (3%). Some 13% of current living immigrants come from Europe and Canada, and 10% from the Caribbean.282 Among new arrivals, Asian immigrants have been more numerous than Hispanic immigrants since 2010; in 2017, 37.4% of immigrant arrivals were Asian, and 26.6% were Hispanic.282 Until 2017 and 2018, the United States led the world in refugee resettlement for decades, admitting more refugees than the rest of the world combined.284 From fiscal year 1980 until 2017, 55% of refugees came from Asia, 27% from Europe, 13% from Africa, and 4% from Latin America, fleeing war and persecution.284
- Net migration rate (2024): 3 migrants/1,000 population.7 Country comparison to the world: 38th7
- Net migration rate* (2020-2021): 0.73 migrants/1,000 population.285
*(mid-year estimates)
As of 2017, 13.6% (44.4 million) of the population was foreign-born – an increase from 4.7% in 1970 but less than the 1890 record of 14.8%. Some 45% of the foreign-born population were naturalized US citizens. Around 23% (10.3 million) of the foreign-born community is undocumented, accounting for 3.2% of the total population.282 According to the 2010 census, Latin America and the Caribbean is the largest region-of-birth group, accounting for 53% of the foreign-born population. As of 2018, this region is still the largest source of immigrants to the United States.286287288 In 2018, there were almost 90 million immigrants and U.S. born children of immigrants (second-generation Americans) in the United States, accounting for 28% of the overall U.S. population.289 In 2018, 1,096,611 immigrants were granted either permanent or temporary legal residence in the United States290
| Region | 2021 |
|---|---|
| Americas | 311,806 |
| Asia | 295,306 |
| Africa | 66,211 |
| Europe | 61,521 |
| Oceania | 4,147 |
| Not Specified | 1,011 |
| Total | 707,362 |
| Class of Admission (Adjustments of Status and New Arrivals) | 2021 |
|---|---|
| Immediate relatives of U.S. citizens | 385,396 |
| Family-sponsored preferences | 65,690 |
| Employment-based preferences | 193,338 |
| Diversity | 15,145 |
| Refugees | 35,847 |
| Asylees | 20,550 |
| Parolees | 13 |
| Children born abroad to alien residents | 75 |
| Certain Iraqis and Afghans employed by U.S. Government and their spouses and children | 8,303 |
| Cancellation of removal | 5,017 |
| Victims of human trafficking | 942 |
| Victims of crimes and their spouses and children | 9,257 |
| Other | 429 |
Emigration and Expatriation
As of April 2015, the U.S. State Department estimated that 8.7 million American citizens live overseas. Americans living abroad are not counted in the U.S. Census unless they are federal government employees or dependents of a federal employee.293 A 2010 paper estimated the number of civilian Americans living abroad to be around 4 million.294 So-called "accidental Americans" are citizens of a country other than the United States who may also be considered U.S. citizens or be eligible for U.S. citizenship under specific laws but are not aware of having such status (or became aware of it only recently).295
As of 2022, 1.6 million Americans live in Mexico, according to the State Department.296
Economics
Income
In 2020, the median household income in the United States was around $67,521, 2.9 percent less than the 2019 median of $69,560.297 Household and personal income depends on variables such as race, number of income earners, educational attainment and marital status.
| Type of household | Race and Hispanic origin | Region | ||||||||
|---|---|---|---|---|---|---|---|---|---|---|
| All households | Family households |
Nonfamily households |
Asian | Non-Hispanic White | Hispanic (of any race) |
Black | Northeast | Midwest | South | West |
| $70,784 | $91,162 | $41,797 | $101,418 | $77,999 | $57,981 | $48,297 | $77,422 | $71,129 | $63,368 | $79,430 |
| Age of Householder | Nativity of Householder | Metropolitan Statistical Area (MSA) Status | Educational Attainment of Householder* | ||||||
|---|---|---|---|---|---|---|---|---|---|
| Under 65 years | 65 years and older | Native-born | Foreign-born | Inside MSA | Outside MSA | No high school diploma | High school, no college | Some college | Bachelor's degree or higher |
| $80,734 | $47,620 | $71,522 | $66,043 | $73,823 | $53,750 | $30,378 | $50,401 | $64,378 | $115,456 |
| *Householders aged 25 and older. In 2021, the median household income for this group was $72,046. | |||||||||
| Total workers | Full-Time, year-round workers | ||||
|---|---|---|---|---|---|
| Both sexes | Male | Female | Both sexes | Male | Female |
| $45,470 | $50,983 | $39,201 | $56,473 | $61,180 | $51,226 |
| Measure | Overall | Less than 9th grade | Some High School | High school graduate | Some college | Associate's degree | Bachelor's degree or higher | Bachelor's degree | Master's degree | Professional degree | Doctorate degree |
|---|---|---|---|---|---|---|---|---|---|---|---|
| Persons, age 25+ w/ earnings* | $46,985 | $25,162 | $26,092 | $34,540 | $39,362 | $42,391 | $66,423 | $60,705 | $71,851 | $102,741 | $101,526 |
| Male, age 25+ w/ earnings* | $52,298 | $30,089 | $31,097 | $40,852 | $47,706 | $52,450 | $80,192 | $71,666 | $91,141 | $126,584 | $121,956 |
| Female, age 25+ w/ earnings* | $40,392 | $18,588 | $19,504 | $27,320 | $31,837 | $36,298 | $57,355 | $51,154 | $62,522 | $92,780 | $85,551 |
| Persons, age 25+, employed full-time | $59,371 | $33,945 | $34,897 | $42,417 | $50,640 | $52,285 | $77,105 | $71,283 | $82,183 | $130,466 | $119,552 |
| Household | $69,228 | $29,609 | $29,520 | $47,405 | $60,392 | $68,769 | $106,936 | $100,128 | $114,900 | $151,560 | $142,493 |
| *Total work experience | |||||||||||
| 10th percentile | 20th percentile | 30th percentile | 40th percentile | 50th percentile | 60th percentile | 70th percentile | 80th percentile | 90th percentile | 95th percentile |
|---|---|---|---|---|---|---|---|---|---|
| ≤ $15,700 | ≤ $28,000 | ≤ $40,500 | ≤ $55,000 | $70,800 | ≤ $89,700 | ≤ $113,200 | ≤ $149,100 | ≤ $212,100 | ≤ $286,300 |
| Source: US Census Bureau, 2021; income statistics for the year 2021 | |||||||||
-
![Counties in the United States by the percentage of the over 25-year-old population with bachelor's degrees according to the U.S. Census Bureau American Community Survey 2013–2017 5-Year Estimates.[301] Counties with higher percentages of bachelor's degrees than the United States as a whole are in full orange.](/api/ext/img?url=https%3A%2F%2Fupload.wikimedia.org%2Fwikipedia%2Fcommons%2Fthumb%2F1%2F18%2FUS_counties_by_percentage_BAs.png%2F330px-US_counties_by_percentage_BAs.png) Counties in the United States by the percentage of the over 25-year-old population with bachelor's degrees according to the U.S. Census Bureau American Community Survey 2013–2017 5-Year Estimates.301 Counties with higher percentages of bachelor's degrees than the United States as a whole are in full orange.
Counties in the United States by the percentage of the over 25-year-old population with bachelor's degrees according to the U.S. Census Bureau American Community Survey 2013–2017 5-Year Estimates.301 Counties with higher percentages of bachelor's degrees than the United States as a whole are in full orange. -
![States in the United States by the percentage of the over 25-year-old population with bachelor's degrees according to the U.S. Census Bureau American Community Survey 2013–2017 5-Year Estimates.[301] States with higher percentages of bachelor's degrees than the United States as a whole are in full orange.](/api/ext/img?url=https%3A%2F%2Fupload.wikimedia.org%2Fwikipedia%2Fcommons%2Fthumb%2F5%2F5b%2FUS_states_by_percentage_BAs.png%2F330px-US_states_by_percentage_BAs.png) States in the United States by the percentage of the over 25-year-old population with bachelor's degrees according to the U.S. Census Bureau American Community Survey 2013–2017 5-Year Estimates.301 States with higher percentages of bachelor's degrees than the United States as a whole are in full orange.
States in the United States by the percentage of the over 25-year-old population with bachelor's degrees according to the U.S. Census Bureau American Community Survey 2013–2017 5-Year Estimates.301 States with higher percentages of bachelor's degrees than the United States as a whole are in full orange.
-
![Counties in the United States by per capita income according to the U.S. Census Bureau American Community Survey 2013–2017 5-Year Estimates.[302] Counties with per capita incomes higher than the United States as a whole are in full green.](/api/ext/img?url=https%3A%2F%2Fupload.wikimedia.org%2Fwikipedia%2Fcommons%2Fthumb%2F7%2F7e%2FUS_counties_by_per_capita_income.png%2F330px-US_counties_by_per_capita_income.png) Counties in the United States by per capita income according to the U.S. Census Bureau American Community Survey 2013–2017 5-Year Estimates.302 Counties with per capita incomes higher than the United States as a whole are in full green.
Counties in the United States by per capita income according to the U.S. Census Bureau American Community Survey 2013–2017 5-Year Estimates.302 Counties with per capita incomes higher than the United States as a whole are in full green. -
![States in the United States by per capita income according to the U.S. Census Bureau American Community Survey 2013–2017 5-Year Estimates.[302] States with per capita incomes higher than the United States as a whole are in full green.](/api/ext/img?url=https%3A%2F%2Fupload.wikimedia.org%2Fwikipedia%2Fcommons%2Fthumb%2F1%2F18%2FUS_states_by_per_capita_income.png%2F330px-US_states_by_per_capita_income.png) States in the United States by per capita income according to the U.S. Census Bureau American Community Survey 2013–2017 5-Year Estimates.302 States with per capita incomes higher than the United States as a whole are in full green.
States in the United States by per capita income according to the U.S. Census Bureau American Community Survey 2013–2017 5-Year Estimates.302 States with per capita incomes higher than the United States as a whole are in full green.
-
![Counties in the United States by median nonfamily household income according to the U.S. Census Bureau American Community Survey 2013–2017 5-Year Estimates.[302] Counties with median nonfamily household incomes higher than the United States as a whole are in full green.](/api/ext/img?url=https%3A%2F%2Fupload.wikimedia.org%2Fwikipedia%2Fcommons%2Fthumb%2F5%2F50%2FUS_counties_by_median_nonfamily_income.png%2F330px-US_counties_by_median_nonfamily_income.png) Counties in the United States by median nonfamily household income according to the U.S. Census Bureau American Community Survey 2013–2017 5-Year Estimates.302 Counties with median nonfamily household incomes higher than the United States as a whole are in full green.
Counties in the United States by median nonfamily household income according to the U.S. Census Bureau American Community Survey 2013–2017 5-Year Estimates.302 Counties with median nonfamily household incomes higher than the United States as a whole are in full green. -
![States in the United States by median nonfamily household income according to the U.S. Census Bureau American Community Survey 2013–2017 5-Year Estimates.[302] States with median nonfamily household incomes higher than the United States as a whole are in full green.](/api/ext/img?url=https%3A%2F%2Fupload.wikimedia.org%2Fwikipedia%2Fcommons%2Fthumb%2Fb%2Fb3%2FUS_states_by_median_nonfamily_income.png%2F330px-US_states_by_median_nonfamily_income.png) States in the United States by median nonfamily household income according to the U.S. Census Bureau American Community Survey 2013–2017 5-Year Estimates.302 States with median nonfamily household incomes higher than the United States as a whole are in full green.
States in the United States by median nonfamily household income according to the U.S. Census Bureau American Community Survey 2013–2017 5-Year Estimates.302 States with median nonfamily household incomes higher than the United States as a whole are in full green.
-
![Counties in the United States by median family household income according to the U.S. Census Bureau American Community Survey 2013–2017 5-Year Estimates.[302] Counties with median family household incomes higher than the United States as a whole are in full green.](/api/ext/img?url=https%3A%2F%2Fupload.wikimedia.org%2Fwikipedia%2Fcommons%2Fthumb%2F4%2F4c%2FUS_counties_by_median_family_income.png%2F330px-US_counties_by_median_family_income.png) Counties in the United States by median family household income according to the U.S. Census Bureau American Community Survey 2013–2017 5-Year Estimates.302 Counties with median family household incomes higher than the United States as a whole are in full green.
Counties in the United States by median family household income according to the U.S. Census Bureau American Community Survey 2013–2017 5-Year Estimates.302 Counties with median family household incomes higher than the United States as a whole are in full green. -
![States in the United States by median family household income according to the U.S. Census Bureau American Community Survey 2013–2017 5-Year Estimates.[302] States with median family household incomes higher than the United States as a whole are in full green.](/api/ext/img?url=https%3A%2F%2Fupload.wikimedia.org%2Fwikipedia%2Fcommons%2Fthumb%2Ff%2Ffb%2FUS_states_by_median_family_income.png%2F330px-US_states_by_median_family_income.png) States in the United States by median family household income according to the U.S. Census Bureau American Community Survey 2013–2017 5-Year Estimates.302 States with median family household incomes higher than the United States as a whole are in full green.
States in the United States by median family household income according to the U.S. Census Bureau American Community Survey 2013–2017 5-Year Estimates.302 States with median family household incomes higher than the United States as a whole are in full green.
Economic class
Social classes in the United States lack distinct boundaries and may overlap. Even their existence (when distinguished from economic strata) is controversial. The following table provides a summary of some prominent academic theories on the stratification of American society:
| Dennis Gilbert, 2002 | William Thompson & Joseph Hickey, 2005 | Leonard Beeghley, 2004 | |||
|---|---|---|---|---|---|
| Class | Typical characteristics | Class | Typical characteristics | Class | Typical characteristics |
| Capitalist class (1%) | Top-level executives, high-rung politicians, heirs. Ivy League education common. | Upper class (1%) | Top-level executives, celebrities, heirs; income of $500,000+ common. Ivy League education common. | The super-rich (0.9%) | Multi-millionaires whose incomes commonly exceed $3.5 million or more; includes celebrities and powerful executives/politicians. Ivy League education common. |
| Upper middle class[1] (15%) | Highly-educated (often with graduate degrees), most commonly salaried, professionals and middle management with large work autonomy. | Upper middle class[1] (15%) | Highly-educated (often with graduate degrees) professionals & managers with household incomes varying from the high 5-figure range to commonly above $100,000. | The rich (5%) | Households with net worth of $1 million or more; largely in the form of home equity. Generally have college degrees. |
| Middle class (plurality/ majority?; ca. 46%) |
College-educated workers with considerably higher-than-average incomes and compensation; a man making $57,000 and a woman making $40,000 may be typical. | ||||
| Lower middle class (30%) | Semi-professionals and craftsmen with a roughly average standard of living. Most have some college education and are white-collar. | Lower middle class (32%) | Semi-professionals and craftsmen with some work autonomy; household incomes commonly range from $35,000 to $75,000. Typically, some college education. | ||
| Working class (30%) | Clerical and most blue-collar workers whose work is highly routinized. Standard of living varies depending on number of income earners, but is commonly just adequate. High school education. | ||||
| Working class (32%) | Clerical, pink- and blue-collar workers with often low job security; common household incomes range from $16,000 to $30,000. High school education. | Working class (ca. 40–45%) |
Blue-collar workers and those whose jobs are highly routinized with low economic security; a man making $40,000 and a woman making $26,000 may be typical. High school education. | ||
| Working poor (13%) | Service, low-rung clerical and some blue-collar workers. High economic insecurity and risk of poverty. Some high school education. | ||||
| Lower class (ca. 14–20%) | Those who occupy poorly-paid positions or rely on government transfers. Some high school education. | ||||
| Underclass (12%) | Those with limited or no participation in the labor force. Reliant on government transfers. Some high school education. | The poor (ca. 12%) | Those living below the poverty line with limited to no participation in the labor force; a household income of $18,000 may be typical. Some high school education. | ||
| |||||
Unemployment rate (seasonally adjusted)

<3.0%
<3.5%
<4.0%
<4.5%
<5.0%
<5.5%
<6.0%
<6.5%
≥6.5%
| Year | Unemployment Rate |
|---|---|
| As of May 2025 | 4.2% 304 |
| As of July 2024 | 4.2%305 |
| As of July 2023 | 3.5%305 |
| As of July 2022 | 3.5%305 |
| As of July 2021 | 5.4%305 |
| As of July 2020 | 10.2%305 |
| As of July 2019 | 3.7%305 |
| As of July 2018 | 3.7%305 |
| As of July 2017 | 4.3%306 |
| As of July 2016 | 4.9% 306 |
| As of July 2015 | 5.3% 307 |
| As of July 2014 | 6.2% 306 |
The U6 unemployment rate as of April 2017 was 8.6 percent.308 The U6 unemployment rate counts not only people without work seeking full-time employment (the more familiar U3 rate), but also counts "marginally attached workers and those working part-time for economic reasons." Some of these part-time workers counted as employed by U6 could be working as little as an hour a week. And the "marginally attached workers" include those who have become discouraged and stopped looking, but still want to work. The age considered for this calculation is 16 years and over.
Urban Americans have more job opportunities than those in more rural areas. From 2008 to 2018, 72% of the nation's employment growth occurred in cities with more than one million residents, which account for 56% of the overall population.309
Generational cohorts

A definitive recent study of U.S. generational cohorts was done by Schuman and Scott (2012) in which a broad sample of adults of all ages was asked, "What world events are especially important to you?"310 They found that 33 events were mentioned with great frequency. When the ages of the respondents were correlated with the expressed importance rankings, seven (some indicated eight or nine) distinct cohorts became evident.
Today the following descriptors are frequently used for these cohorts:
| Generation | Birth years | Notes | Citation |
|---|---|---|---|
| Lost Generation | 1883 – 1900 | Came of age during World War I; known for disillusionment and questioning of traditional values. | 311 |
| Greatest Generation | 1901 – 1927 | Also called the "G.I. Generation"; fought in World War II. | 312 |
| Silent Generation | 1928 – 1945 | Grew up during the Great Depression and World War II; includes most who fought in the Korean War. | 313 |
| Baby boomers | 1946 – 1964 | The large generation of children born after World War II to the Greatest and Silent Generations; also called "boomers". | 314 |
| Generation X | 1965 – 1980 | Sometimes called the "baby bust" generation due to declining birth rates after the baby boom. | 315 |
| Millennials | 1981 – 1996 | Also known as "Generation Y"; often the children of boomers. | 316 |
| Generation Z | c. 1997 – 2012 | Also known as "zoomers"; often the children of Generation X. | 317 |
| Generation Alpha | Early 2010s – mid-2020s | First generation fully raised in a digital world; often the children of millennials. | 318 |
U.S. demographic birth cohorts
View source data.
Birth rate, death rate and natural increase rate in the United States 1935–2021
Subdivided groups are present when peak boom years or inverted peak bust years are present, and may be represented by a normal or inverted bell-shaped curve (rather than a straight curve). The boom subdivided cohorts may be considered as "pre-peak" (including peak year) and "post-peak". The year 1957 was the baby boom peak with 4.3 million births and 122.7 fertility rate. Although post-peak births (such as trailing edge boomers) are in decline, and sometimes referred to as a "bust", there are still a relatively large number of births. The dearth-in-birth bust cohorts include those up to the valley birth year, and those including and beyond, leading up to the subsequent normal birth rate. The baby boom began around 1943 to 1946.319
From the decline in U.S. birth rates starting in 1958 and the introduction of the birth control pill in 1960, the Baby Boomer normal distribution curve is negatively skewed. The trend in birth rates from 1958 to 1961 show a tendency to end late in the decade at approximately 1969, thus returning to levels prior to World War II, with 12 years of rising and 12 years of declining birth rates. Pre-war birth rates were defined as anywhere between 1939 and 1941 by demographers such as the Taeuber's, Philip M. Hauser and William Fielding Ogburn.320
Mobility
In 2021, 27.1 million Americans said they were living in a different place than a year before, compared to 29.8 million in 2020. This reflects an 8.4% mover rate, the lowest recorded in more than 70 years.321
Education
In 2022 the most common level of highest educational attainment among those 25 years old and up (who were civilian and not institutionalized) was completing high school.322
Housing
According to the 2020 United States Census, the country had a total of 140,498,736 housing units, of which 126,817,580 (90.3%) were occupied and 13,681,156 (9.7%) were classified as being vacant, irrespective of status ("for rent", "rented, not occupied", "for sale only", "sold, not occupied", "for seasonal, recreational, or occasional use", among others). Of the occupied units, 80,051,358 units (63.1%) were owner-occupied, while 46,766,222 units (36.9%) were occupied by tenants. 323
In the 2024 1-year American Community Survey the median number of rooms in a housing unit was 5.5 with the most common amount of rooms for a housing unit being 5 per unit.324 Homes have more excess bedrooms (bedrooms which are not occupied) than in the past compared to 1970 and 1980 but home sizes on average have decreased since the 2010s.325 It was also reported in the 2024 survey that among occupied housing units the most common fuel for heating was "Utility gas".324
U.S. housing units
1-year ACS estimates
| Year | Occupied | Vacant | Total | |||||
|---|---|---|---|---|---|---|---|---|
| Total units | Margin of error | Total units | Margin of error | |||||
| # | % | # | % | # | Margin of error | |||
| 2024326 | 132,737,146 | 90.46% | 140,273 | 14,003,818 | 9.54% | 145,175 | 146,740,964 | 8,590 |
| 2023327 | 131,332,360 | 90.37% | 130,190 | 14,001,102 | 9.63% | 137,938 | 145,333,462 | 10,062 |
| 2022328 | 129,870,928 | 90.33% | 136,261 | 13,901,967 | 9.67% | 141,204 | 143,772,895 | 7,466 |
| 2021329 | 127,544,730 | 89.73% | 97,632 | 14,603,320 | 10.27% | 99,060 | 142,148,050 | 4,219 |
| 2019330 | 122,802,852 | 87.91% | 137,327 | 16,883,357 | 12.09% | 142,908 | 139,686,209 | 6,973 |
| 2018331 | 121,520,180 | 87.71% | 153,217 | 17,019,726 | 12.29% | 155,617 | 138,539,906 | 4033 |
5-year ACS estimates
For reference, the 5-year ACS estimate is taken every year is collected for all areas regardless of population over a 5-year period compared to the 1-year estimates which are collected within a year and only cover areas with a population at or over 65,000+ people.332
| Year | Occupied | Vacant | Total | |||||
|---|---|---|---|---|---|---|---|---|
| Total units | Margin of error | Total units | Margin of error | # | Margin of error | |||
| # | % | # | % | |||||
| 2024333 | 129,227,496 | 89.88% | 209,365 | 14,547,859 | 10.12% | 200,366 | 143,775,355 | 10,234 |
| 2023334 | 127,482,865 | 89.57% | 208,633 | 14,850,011 | 10.43% | 200,112 | 142,332,876 | 9,434 |
| 2022335 | 125,736,353 | 89.21% | 198,714 | 15,207,260 | 10.79% | 198,996 | 140,943,613 | 3,164 |
| 2021336 | 124,010,992 | 88.8% | 196,755 | 15,636,028 | 11.2% | 197,425 | 139,647,020 | 3,504 |
| 2020337 | 122,354,219 | 88.39% | 201,880 | 16,078,532 | 11.61% | 201,880 | 138,432,751 | 11,188 |
| 2019338 | 120,756,048 | 87.87% | 236,892 | 16,672,938 | 12.13% | 231,631 | 137,428,986 | 6,044 |
| 2018339 | 119,730,128 | 87.79% | 232,429 | 16,654,164 | 12.21% | 226,286 | 136,384,292 | 6,639 |
Housing units by year of construction
A plurality of housing units were built in the 1970s according to 2024 1-year American Community Survey and the 5-year survey.324340 Data is as of the 2024 1-year American Community Survey. Table source:324
| Year built | Number of units | Percentage of units | Margin of error (#) |
|---|---|---|---|
| 2020-present | 5,967,001 | 4.07% | 57,397 |
| 2010-2019 | 14,282,223 | 9.73% | 63,223 |
| 2000-2009 | 19,982,040 | 13.62% | 66,348 |
| 1990-1999 | 17,382,714 | 11.85% | 69,938 |
| 1980-1989 | 18,481,899 | 12.59% | 63,887 |
| 1970-1979 | 20,140,923 | 13.73% | 80,917 |
| 1960-1969 | 14,113,943 | 9.62% | 68,220 |
| 1950-1959 | 13,358,031 | 9.1% | 62,729 |
| 1940-1949 | 6,210,969 | 4.23% | 44,283 |
| 1939 and before | 16,821,221 | 11.46% | 63,157 |
| Total | 146,740,964 | 100% |
Housing and facilities
Plumbing and housing facilities
This table only looks at occupied housing units and this table shows results from the 1-year American Community Survey.
| Status | With full plumbing | Lacking full plumbing | Margin of error for homes lacking plumbing | Total | |||
|---|---|---|---|---|---|---|---|
| Year | # | % | # | % | # | % | |
| 2024341 | 132,190,518 | 99.59% | 546,628 | 0.41% | 13,967 | 0.1% | 132,737,146 |
| 2023342 | 130,785,732 | 99.58% | 548,772 | 0.42% | 13,917 | 0.1% | 131,332,360 |
| 2022343 | 129,337,134 | 99.59% | 533,794 | 0.41% | 13,435 | 0.1% | 129,870,928 |
| 2021344 | 127,021,978 | 99.59% | 522,752 | 0.41% | 14,103 | 0.1% | 127,544,730 |
| 2019345 | 122,341,573 | 99.62% | 461,279 | 0.38% | 14,466 | 0.1% | 122,802,852 |
See also
See also
- Aging of the United States
- Demographic history of the United States
- History of public health in the United States
- Historical Statistics of the United States, the book
- Languages of the United States
- Maps of American ancestries
- Places in the United States with notable demographic characteristics
Lists
- List of metropolitan areas in the Americas
- List of U.S. states and territories by fertility rate
- List of U.S. states and territories by population
- List of U.S. states and territories by race/ethnicity
- List of U.S. states by socioeconomic factors
- Lists of U.S. cities with non-white majority populations
Income
- Affluence in the United States
- Household income in the United States
- List of highest-income counties in the United States
- List of lowest-income counties in the United States
- Personal income in the United States
Population
Notes
Notes
- including Alaska (1930), American Samoa (1930, 1970, 2000, 2020), Guam (1930, 1970, 2000, 2020), Hawaii (1930), Northern Mariana Islands (2000, 2020), Panama Canal Zone (1930, 1970), Philippines (1930), Puerto Rico (1930, 1970, 2000, 2020), Trust Territory of the Pacific Islands (1970), Virgin Islands (1930, 1970, 2000, 2020), and various largely uninhabited Minor Outlying Islands
- Not enumerated in 1930. "Persons of Spanish origin" in 1970.
- Includes 1,422,533 "Mexican" responses.
- "Negro" in 1930 and 1970.
- Not enumerated in 1930 or 1970.
- Includes 74,954 "Chinese", 138,834 "Japanese", 45,208 "Filipino", 3,130 "Hindu", 1,860 "Korean", 96 "Malay", and 18 "Siamese" responses.
- All Americans not of the "White", "Black", or "Indian" races who did not identify as "of Spanish origin".
- "Indian" in 1930 and 1970.
- Not enumerated in 1930 or 1970.
- Includes 660 "Hawaiian" and 6 "Samoan" responses.
- Not enumerated in 1930 or 1970.
- Not enumerated in 1930 or 1970.
- In fertility rates, 2.1 and above is a stable population and has been marked blue, 2 and below leads to an aging population and the result is that the population decreases.
References
References
- "National Population Totals and Components of Change: April 1, 2020 to July 1, 2025". United States Census Bureau. January 27, 2025. Retrieved January 28, 2025.
- "U.S. Census Bureau Today Delivers State Population Totals for Congressional Apportionment". United States Census. Retrieved April 26, 2021. The 2020 census is as of April 1, 2020.
- "U.S. Population Growth Slows Due to Historic Decline in Net International Migration". U.S. Census Bureau. January 27, 2026. Retrieved February 2, 2026.
- Xu, Jiaquan; Murphy, Sherry; Kochanek, Kenneth D.; Arias, Elizabeth (January 29, 2026). "Mortality in the United States 2024". National Center for Health Statistics Brief / CDC. Retrieved February 1, 2026.
- Martin, Joyce; Hamilton, Brady; Osterman, Michelle (2025). "Births in the United States, 2024". NCHS Data Brief (535): 1. doi:10.15620/cdc/174613. PMC 12477703. PMID 40996517. Retrieved 24 July 2025.
- "Infant Mortality". cdc.gov. 22 June 2022. Retrieved 6 July 2022.
- "Net migration rate". cia.gov. CIA. Archived from the original on January 4, 2021. Retrieved 1 October 2025.
- "Annual Estimates of the Resident Population for Selected Age Groups by Sex for the United States: April 1, 2020 to July 1, 2023 (NC-EST2023-AGESEX)". Census.gov. U.S. Census Bureau, Population Division. June 2024. Retrieved 2025-01-21.
- Osterman, Michelle; Hamilton, Brady; et al. (4 April 2024). Births: Final Data for 2022 (PDF). National Vital Statistics Reports (Technical report). U.S. Department of Health and Human Services, Centers for Disease Control and Prevention, National Center for Health Statistics. p. 31. Retrieved 21 January 2025.
- "Race and Ethnicity in the United States: 2010 Census and 2020 Census". U.S. Census Bureau. August 12, 2021. Archived from the original on October 7, 2021. Retrieved September 18, 2021.
- "Detailed Races and Ethnicities in the United States and Puerto Rico: 2020 Census". United States census. September 21, 2023. Retrieved October 21, 2023.
- "Detailed Races and Ethnicities in the United States and Puerto Rico: 2020 Census". United States census. September 21, 2023. Retrieved October 21, 2023.
- "Detailed Races and Ethnicities in the United States and Puerto Rico: 2020 Census". United States census. September 21, 2023. Retrieved October 21, 2023.
- "Detailed Races and Ethnicities in the United States and Puerto Rico: 2020 Census". United States census. September 21, 2023. Retrieved October 21, 2023.
- "Detailed Races and Ethnicities in the United States and Puerto Rico: 2020 Census". United States census. September 21, 2023. Retrieved October 21, 2023.
- "Detailed Races and Ethnicities in the United States and Puerto Rico: 2020 Census". United States census. September 21, 2023. Retrieved October 21, 2023.
- Vivian Ho; Rachel Pannett (March 1, 2025). "A Trump order made English the official language of the U.S. What does that mean?". The Washington Post.
- Luke Broadwater (March 1, 2025). "Trump Signs Order to Designate English as Official Language of the U.S." The New York Times.
- Kaczke, Lisa (25 March 2019). "South Dakota recognizes official indigenous language". Argus Leader.
- "Samoa now an official language of instruction in American Samoa". Radio New Zealand International. 2008-10-03.
- "Guam". Encyclopædia Britannica. 2018-10-24.
- "Northern Mariana Islands". Encyclopædia Britannica. 2018-10-19.
- Crawford, James. "Puerto Rico and Official English". Language Policy.net. Retrieved April 27, 2011.
- "Explore Census Data". Retrieved April 18, 2025.
- "U.S. Population Growth Slows Due to Historic Decline in Net International Migration". U.S. Census Bureau. January 27, 2026. Retrieved February 2, 2026.
- "U.S. Population Grows at Fastest Pace in More than Two Decades". U.S. Census Bureau. December 19, 2024. Retrieved January 14, 2025.
- "Population growth rate". The World Factbook. Central Intelligence Agency. Archived from the original on January 8, 2021. Retrieved 25 November 2024.
- "Illinois ranks as 'most normal state' in U.S. according to Washington Post data analysis". Illinois. WMAQ-TV. 2024-05-14. Retrieved 2024-05-15.
- "Statistical Abstract of the United States" (PDF). U.S. Census Bureau. 2005. Retrieved October 25, 2015.
- "U.S. population hits 300 million mark". MSNBC. Associated Press. October 17, 2006. Archived from the original on October 17, 2006. Retrieved October 17, 2006.
- "Modern Immigration Wave Brings 59 Million to U.S." Pew Research Center's Hispanic Trends Project. September 28, 2015.
- "Changing Patterns in U.S. Immigration and Population". The Pew Charitable Trusts. 18 December 2014.
- "New 2024 population estimates show nation's population grew by about 1% to 340.1 million since 2023". U.S. Census Bureau. December 19, 2024. Retrieved December 24, 2024.
- "U.S. Population Growth Slows Due to Historic Decline in Net International Migration". U.S. Census Bureau. January 27, 2026. Retrieved February 2, 2026.
- "Children of color projected to be majority of U.S. youth this year". PBS NewsHour. January 9, 2020.
- "Racial and Ethnic Diversity in the United States: 2010 Census and 2020 Census". U.S. Census Bureau. Retrieved 2022-03-03.
- "2020 Census Illuminates Racial and Ethnic Composition of the Country". Census.gov. Retrieved 2022-06-27.
- "U.S. Population Projections: 2005–2050". Pew Hispanic Center. February 11, 2008. Archived from the original on November 30, 2011. Retrieved September 19, 2011.
- Lemi, Danielle Casarez (2021-09-23). "Analysis - U.S. census racial categories have shifted over centuries. How will the jump in multiracials affect politics?". Washington Post. Retrieved 2023-06-19. "Asian Americans — the fastest-growing racial group in America — grew 35.5 percent, while Asian plus another race grew 55.5 percent."
- Foster-Frau, Silvia (2021-10-08). "'We're talking about a big, powerful phenomenon': Multiracial Americans drive change". Washington Post. Retrieved 2023-06-19.
- "About Provisional Natality, 2023 through Last Month". Retrieved 25 April 2026.
- "National Population Totals and Components of Change: 2020-2024".
- Hobbs, Frank; Stoops, Nicole (November 2002). "Census 2000 Special Reports: Demographics Trends in the 20th Century" (PDF). U.S. Census Bureau. Archived from the original (PDF) on January 20, 2012.
- Bennett, Claudette E. (September 1993). "We the Americans: Blacks" (PDF). U.S. Census Bureau. Archived from the original (PDF) on 2010-03-26.
- Saenz, Rogelio (August 2004). "Latinos and the Changing Face of America". Population Reference Bureau. Archived from the original on May 19, 2012.
- Fredrickson, George M. (2005). Foner, Nancy; Fredrickson, George M. (eds.). Not Just Black and White: Historical and Contemporary Perspectives on Immigration, Race, and Ethnicity in the United States. Russell Sage Foundation. p. 120. ISBN 0-87154-270-6.
- Papademetriou, Demetrios G.; Terrazas, Aaron (April 2009). "Immigrants in the United States and the Current Economic Crisis". Migration Policy Institute. Archived from the original on 2010-03-04.
- Segal, Uma A.; Elliott, Doreen; Mayadas, Nazneen S. (2010). Immigration Worldwide: Policies, Practices, and Trends. Oxford University Press US. p. 32. ISBN 978-0-19-538813-8.
- Borjas, George J. (2003). "Welfare reform, labor supply, and health insurance in the immigrant population". Journal of Health Economics. 22 (6): 933–958. CiteSeerX 10.1.1.517.7531. doi:10.1016/j.jhealeco.2003.05.002. ISSN 0167-6296. PMID 14604554. S2CID 488620.
- "The First Measured Century: An Illustrated Guide to Trends in America, 1900–2000". Public Broadcasting Service.
- Exner, Rich (July 3, 2012). "Americans under age 1 now mostly minorities, but not in Ohio: Statistical Snapshot". The Plain Dealer. Retrieved July 29, 2012.
- "Non-white births outnumber white births for the first time in US". The Daily Telegraph. May 17, 2012. Archived from the original on 2012-05-18.
- "Births: Final Data for 2014" (PDF). Centers for Disease Control and Prevention. Retrieved October 3, 2017.
- "Median Age Of The Total Population". American FactFinder. Retrieved October 3, 2017.
{{cite web}}: CS1 maint: deprecated archival service (link) - Howard, Jacqueline (January 10, 2019). "US fertility rate is below level needed to replace population, study says". CNN.
- Mathews, T.J.; Hamilton, Brady E. (January 10, 2019). "Total Fertility Rates by State and Race and Hispanic Origin: United States, 2017" (PDF). Centers for Disease Control and Prevention.
- Tavernise, Sabrina (June 20, 2018). "Fewer Births Than Deaths Among Whites in Majority of U.S. States". The New York Times. Retrieved 28 December 2024.
- "Table A. Apportionment Population, Resident Population, and Overseas Population: 2020 Census and 2010 Census" (PDF).
- Blakeslee, Laura; Caplan, Zoe; Meyer, Julie A.; Rabe, Megan A.; Roberts, Andrew W. (2023). Age and Sex Composition: 2020 - 2020 Census Briefs (PDF). United States Census Bureau. Retrieved July 28, 2025.
- "Numerical Predominance of Women over Men in the United States". Journal of the American Medical Association. 150 (12): 1222–1223. 1952-11-22. doi:10.1001/jama.1952.03680120058013. ISSN 0002-9955. PMID 12990393.
- "National Population by Characteristics: 2020-2021". Census.gov. Retrieved 2022-07-06.
- name= "2002pub""Feature Article 1: Population by Age and Sex, Australian States and Territories". Australian Bureau of Statistics. 16 December 2011.
- "Dependency ratios - The World Factbook". www.cia.gov. Archived from the original on January 8, 2021. Retrieved 2022-07-06.
- "PEPANNRES – Annual Estimates of the Resident Population: April 1, 2010 to July 1, 2018". U.S. Census Bureau. Retrieved October 17, 2019.
{{cite web}}: CS1 maint: deprecated archival service (link) - "Table 13. State Population – Rank, Percent Change, and Population Density". U.S. Census Bureau. 2008. Archived from the original (Excel) on September 23, 2015. Retrieved October 24, 2010.
- "Mean Center of Population for the United States: 1790 to 2000" (PDF). U.S. Census Bureau. Archived from the original (PDF) on November 3, 2001. Retrieved October 24, 2010.
- "Annual Estimates of the Resident Population for Incorporated Places over 110,000, Ranked by July 1, 2009 Population: April 1, 2000 to July 1, 2009 (SUB-EST2009-01)". U.S. Census Bureau. Archived from the original on October 18, 2010. Retrieved May 19, 2011.
- "The World Factbook: Puerto Rico". CIA. Archived from the original on January 5, 2021. Retrieved July 1, 2020.
- "The World Factbook: Northern Mariana Islands". CIA. Archived from the original on January 12, 2021. Retrieved July 1, 2020.
- "The World Factbook: American Samoa". CIA. Archived from the original on January 4, 2021. Retrieved July 1, 2020.
- Historical Statistics of the United States – Colonial Times To 1970 – Part 1 (PDF) (Report) (Bicentennial ed.). U.S. Department of Commerce. Bureau of Census. 1975. pp. 19, 50.
- "A Look at the 1940 Census" (PDF). United States Census Bureau. pp. 9, 10, 11, 12, 13.
- "The 2012 Global Cities Index". A.T. Kearney. Retrieved January 5, 2013.
{{cite journal}}: CS1 maint: deprecated archival service (link) - "The World According to GaWC – Classification of cities 2010". 2010. Archived from the original on October 10, 2013. Retrieved January 5, 2013.
- "American cities on the rebound". CBS News. August 5, 2011. Retrieved May 8, 2013.
- "Annual Estimates of the Resident Population for the United States, Regions, States, District of Columbia and Puerto Rico: April 1, 2020 to July 1, 2024 (NST-EST2024-POP)". United States Census Bureau. December 2024. Retrieved November 4, 2025.
- "National Intercensal Population Totals: 2010-2020 | Intercensal Population Estimates of the Resident Population for the United States, Regions, States, District of Columbia and Puerto Rico: April 1, 2010 to April 1, 2020 (NST-EST2020INT-POP)". United States Census Bureau. Retrieved July 24, 2025.
- "State Intercensal Tables: 2000-2010 | Annual Population Estimates | Intercensal Estimates of the Resident Population for the United States, Regions, States, and Puerto Rico: April 1, 2000 to July 1, 2010".
- "Historical National Population Estimates: July 1, 1900 to July 1, 1999 (revised June 28, 2000)". United States Census Bureau. April 11, 2000. Retrieved July 24, 2025.
- 1990 Census of Population - General Population Characteristics - United States (PDF). United States Census Bureau. p. 34.
- "Intercensal Estimates of the Total Resident Population of States: 1980 to 1990". United States Census Bureau. August 1996. Retrieved November 4, 2025.
- Mitchell, Brian R. (2003). International historical statistics : the Americas, 1750-2000. Palgrave Macmillan.
- "Historical Statistics of the United States Millennial Edition Online". hsus.cambridge.org. Retrieved 2026-06-02.
- Bureau, US Census. "Population and Housing Unit Estimates Datasets". Census.gov. Retrieved 2026-06-02.
{{cite web}}:|last=has generic name (help) - "VITAL STATISTICS OF THE UNITED STATES 1990 VOLUME I - NATALITY" (PDF).
- "Statistical abstract of the United States, 1951, p8, Est. population of continental US excluding overseas armed forces" (PDF). U.S. Census Bureau.
- "Products - Vital Statistics of the US 1890-1938". www.cdc.gov. 2019-06-06. Retrieved 2025-03-18.
- "Current population reports, 1962, p2" (PDF). U.S. Census Bureau.
- "Fertility rate in the U.S. 1800-2020". Statista. Retrieved 2026-06-02.
- Historical Statistics of the United States – Colonial Times To 1970 – Part 1 (PDF) (Report) (Bicentennial ed.). U.S. Department of Commerce. Bureau of Census. 1975. pp. 19, 50.
- "Fertility rate: children per woman - Our World in Data". 2022-11-27. Archived from the original on 2022-11-27. Retrieved 2025-05-16.
- "Historical Statistics of the United States, Colonial Times to 1970" (PDF). Bureau of the Census. 1975. p. 57/60.
- "United Nations Demographic Yearbook - Historical Supplement" (PDF). United Nations Department of Economic and Social Affairs. 1997. pp. 82–83.
- "National Vital Statistics Report: Infant Mortality in the United States, 2023" (PDF). CDC. 12 June 2025. p. 8.
- "Population and Vital Statistics Report" (PDF). United Nations Department of Economic and Social Affairs. 16 September 2025. p. 14.
- "COVID-19 Coding and Reporting Guidance – Monthly Birth Counts for Maternal Coronavirus Disease (COVID-19)". Centers for Disease Control and Prevention. 2021-03-08. Retrieved 2021-03-13.
- "Mortality in the United States, 2020" (PDF). NCHS Data Brief (427). CDC. Archived (PDF) from the original on December 22, 2021. Retrieved 2021-12-21.
- Births: Final Data for 2020 (PDF) (Report). Centers for Disease Control and Prevention. 7 February 2022. p. 50. Archived (PDF) from the original on 2022-02-07. Retrieved 25 November 2024.
- "Births: Provisional Data for 2021" (PDF). Retrieved 24 May 2022.
- Ahmad, Farida B. (2022). "Provisional Mortality Data — United States, 2021". MMWR. Morbidity and Mortality Weekly Report. 71 (17): 597–600. doi:10.15585/mmwr.mm7117e1. ISSN 0149-2195. PMC 9098238. PMID 35482572.
- "Births: Final Data for 2022" (PDF). CDC>NCHS>National Vital Statistics System. US CDC. Retrieved 8 April 2024.
- Ahmad, Farida B. (2023). "Provisional Mortality Data — United States, 2022". MMWR. Morbidity and Mortality Weekly Report. 72 (18): 488–492. doi:10.15585/mmwr.mm7218a3. ISSN 0149-2195. PMC 10168603. PMID 37141156.
- Fitzpatrick, Alex; Beheraj, Kavya (October 4, 2023). "The birth rate ticked up in 2022. Can the reversal last?". Axios. Retrieved October 7, 2023.
- "CDC WONDER". CDC WONDER. US CDC. Retrieved 3 January 2025.
- "Births in the United States, 2024" (PDF). Vital Statistics Rapid Release. NVSS. Retrieved 11 December 2025.
- "Mortality in the United States: Provisional Data, 2024" (PDF). Vital Statistics Rapid Release. NVSS. Retrieved 11 December 2025.
- "U.S. Population Growth Slows Due to Historic Decline in Net International Migration". Retrieved 27 January 2026.
- "Infant Mortality Dashboard". National Center for Health Statistics.
- "CDC WONDER". CDC WONDER. US CDC. Retrieved 4 June 2026.
- "COVID-19, Declining Birth Rates and International Migration Resulted in Historically Small Population Gains". US Census B.gov. Retrieved 2022-02-16.
- Births: Final Data for 2020 (PDF) (Report). Centers for Disease Control and Prevention. 7 February 2022. p. 50. Archived (PDF) from the original on 2022-02-07. Retrieved 25 November 2024.
- "Provisional number of marriages and marriage rate, divorces and annulments and rate, 2000–2020" (PDF). Centers for Disease Control and Prevention/NCHS National Vital Statistics System. Archived (PDF) from the original on February 16, 2022. Retrieved February 16, 2022.
- "Marriage rates by State: 1990, 1995, and 1999–2019" (PDF). Centers for Disease Control and Prevention/NCHS, National Vital Statistics System. Archived (PDF) from the original on February 14, 2022. Retrieved February 16, 2022.
- Sullivan, Amy (March 20, 2009). "Behind the Boom in Adult Single Motherhood". Time. Archived from the original on March 22, 2009.
- "Blacks rank highest in unwed births". Florida Today. Melbourne, Florida. November 7, 2010. p. 9A. Archived from the original on June 14, 2011. Retrieved November 9, 2010.
- "Births to unmarried women, by race and Hispanic origin of mother: United States, each state and territory, 2020" (PDF). National Vital Statistics Reports. 17 (70). CDC. March 7, 2022. Retrieved February 16, 2022.
- "Birthrate Is Lowest in a Century". The New York Times. Associated Press. August 27, 2010. Retrieved August 28, 2010.
- Kowlessar, N.M.; Jiang, H.J.; Steiner, C. (October 2013). "Hospital Stays for Newborns, 2011". HCUP Statistical Brief (163). Rockville, MD: Agency for Healthcare Research and Quality. PMID 24308074.
- Roan, Shari (March 31, 2011). "Drop in U.S. birth rate is the biggest in 30 years". Los Angeles Times.
- "America's Birth Rate Declined For The Third Year Running". Business Insider. August 12, 2011.
- "Health and Wellness". USA Today.
- "Lower birth rate blamed on the economy". WZZM. February 9, 2013. Retrieved October 3, 2017.
{{cite web}}: CS1 maint: deprecated archival service (link) - "Teen Birth Rates Declined Again in 2009". Centers for Disease Control and Prevention. June 27, 2019. Archived from the original on July 4, 2011.
- "Teen Birth Rates Drop, But Disparities Persist". Centers for Disease Control and Prevention. March 6, 2020.
- Weinstein, Jay; Pillai, Vijayan K. (29 October 2015). Demography: The Science of Population (2nd ed.). Rowman & Littlefield. p. 208. ISBN 978-1-44223521-2.
- Doan, Alesha E. (2007). Opposition and Intimidation:The abortion wars and strategies of political harassment. University of Michigan Press. p. 40. ISBN 978-0-472-06975-0.
- Belluz, Julia (13 January 2020). "The historically low birthrate, explained in 3 charts". Vox. Retrieved 25 November 2024.
- "Births: Provisional Data for 2022" (PDF). cdc.gov. 1 June 2023. Retrieved 3 June 2023.
- Stone, Lyman (May 16, 2018). "Baby Bust: Fertility is Declining the Most Among Minority Women". Institute for Family Studies. Retrieved 25 November 2024.
- "Vital Statistics Rapid Release Quarterly Provisional Estimates". June 29, 2022. Retrieved 10 July 2022.
- Weinstein, Jay; Pillai, Vijayan K. (2016). Demography: The Science of Population (2nd ed.). Rowman & Littlefield. p. 208. ISBN 978-1-442235212.
- Martin, Joyce A.; Hamilton, Brady E.; Driscoll, Anne K.; Osterman, Michelle J. K.; Valenzuela, Claudia P. (February 7, 2022). "Births: Final Data for 2020" (PDF). National Vital Statistics Reports. 70 (1). CDC: 12. PMID 35157571.
- Kekatos, Mary (May 24, 2022). "1st increase in births reported in 7 years, CDC finds". ABC News.
- "Births: Final Data for 2023" (PDF).
- "Natality, 2016-2024 expanded Request". wonder.cdc.gov. Retrieved 2026-01-30.
- "Quarterly Provisional Estimates". Centers for Disease Control and Prevention. February 16, 2023.
- "Number of Births by Race". Kaiser Family Foundation. April 20, 2022.
- Cox, Wendell (July 28, 2022). "US total fertility rates: toward Europe?". Newgeography.com.
- Osterman, Michelle J.K.; Hamilton, Brady E.; Martin, Joyce A.; Driscoll, Anne K.; Valenzuela, Claudia P. (January 31, 2023). "Births: Final Data for 2021" (PDF). National Vital Statistics Reports. 72 (1): 1–53. PMID 36723449.
- Hamilton, Brady E.; Osterman, Michelle J. K.; Martin, Joyce A. (March 2022). "Changes in Births by Month: United States, January 2019–June 2021" (PDF). Centers for Disease Control and Prevention.
- "National Vital Statistics Reports. Births: Final Data for 2015" (PDF). Centers for Disease Control and Prevention. Retrieved October 3, 2017.
- Perry, Susan (January 11, 2019). "U.S. fertility rate continues to decline, reaching lowest level in 40 years". MinnPost.
- "NVSS - Birth Data". Centers for Disease Control and Prevention. June 14, 2021.
- Camarota, Steven A.; Zeigler, Karen. "The Declining Fertility of Immigrants and Natives" (PDF). Center for Immigration Studies. Retrieved October 3, 2017.
- "U.S. life expectancy hits record high as drug overdose deaths decline in 2024". U.S. Centers for Disease Control and Prevention. January 29, 2026. Retrieved February 1, 2026.
- Xu, Jiaquan; Murphy, Sherry; Kochanek, Kenneth D.; Arias, Elizabeth (January 29, 2026). "Mortality in the United States 2024". National Center for Health Statistics Brief / CDC. Retrieved February 1, 2026.
- Arias, Elizabeth; Xu, Jiaquan; Kochanek, Kenneth D. (November 7, 2023). "United States Life Tables, 2021". National Vital Statistics Reports. 72 (12). U.S. Centers for Disease Control and Prevention: 1–64. PMID 38048433. Retrieved January 8, 2025.
- Xu, Jiaquan; Murphy, Sherry; Kochanek, Kenneth D.; Arias, Elizabeth (January 29, 2026). "Mortality in the United States 2024". National Center for Health Statistics Brief / CDC. Retrieved February 1, 2026.
- Xu, Jiaquan; Murphy, Sherry; Kochanek, Kenneth D.; Arias, Elizabeth (January 29, 2026). "Mortality in the United States 2024". National Center for Health Statistics Brief / CDC. Retrieved February 1, 2026.
- Achenbach, Joel (November 26, 2019). "'There's something terribly wrong': Americans are dying young at alarming rates". The Washington Post. Retrieved December 19, 2019.
- "National Vital Statistics System: Life Expectancy". CDC National Center for Health Statistics. November 29, 2024. Retrieved January 8, 2024.
- "U.S. life expectancy hits record high as drug overdose deaths decline in 2024". U.S. Centers for Disease Control and Prevention. January 29, 2026. Retrieved February 1, 2026.
- McPhillips, Deidre (19 December 2024). "US life expectancy has rebounded closer to pre-pandemic levels". CNN. Retrieved 8 January 2025.
- Murphy, Sherry, BS; Kochanek, Kenneth D., MA; Xu, Jiaquan, MD; Arias, Elizabeth, PhD (December 19, 2024). "Mortality in the United States, 2023". NCHS Data Brief (521). CDC National Center for Health Statistics. doi:10.15620/cdc/170564. PMC 11770397. PMID 39819663. Retrieved January 7, 2025.
{{cite journal}}: CS1 maint: multiple names: authors list (link) - Arias, Elizabeth; Xu, Jiaquan (August 8, 2022). "United States Life Tables, 2020" (PDF). National Vital Statistics Reports: From the Centers for Disease Control and Prevention, National Center for Health Statistics, National Vital Statistics System. 71 (1): 1–64. PMID 35947823. Retrieved August 9, 2022.
- "CDC - NCHS - National Center for Health Statistics". www.cdc.gov. 2022-08-30. Retrieved 2022-08-31.
- Arias, Elizabeth; Tejada-Vera, Betzaida; Kochanek, Kenneth D; Ahmad, Farida B (August 2022). "Provisional Life Expectancy Estimates for 2021" (PDF). Centers for Disease Control. Retrieved August 31, 2022.
- "Life expectancy". Our World in Data. Retrieved August 28, 2018.
- except 1918 with only 47 years
- "Mortality in the United States, 2023". www.cdc.gov. 2025-02-11. Retrieved 2025-05-20.
- Xu, Jiaquan; Murphy, Sherry; Kochanek, Kenneth D.; Arias, Elizabeth (January 29, 2026). "Mortality in the United States 2024". National Center for Health Statistics Brief / CDC. Retrieved February 1, 2026.
- "World Population Prospects – Population Division". United Nations Department of Economic and Social Affairs. Archived from the original on September 19, 2016. Retrieved August 25, 2018.
- Bureau, US Census. "2023 National Population Projections Tables: Alternative Scenarios". Census.gov. Retrieved 2026-06-04.
{{cite web}}:|last=has generic name (help) - Methodology, Assumptions, and Inputs for the 2023 National Population Projections (PDF) (Report). United States Census Bureau. November 2023. Retrieved 4 June 2026.
- "Observed and Total Population for the U.S. and the States, 2010–2040".
- "Chapter 2 Color or Race, Nativity, and Parentage" (PDF). www2.census.gov. 10 December 1932. Retrieved 15 June 2025.
- "Race of the Population of the United States, by States: 1970" (PDF). www2.census.gov. February 1972. Retrieved 15 June 2025.
- "Table 2 Persons of Spanish Origin by Race" (PDF). www2.census.gov. June 1973. Retrieved 15 June 2025.
- "P004HISPANIC OR LATINO, AND NOT HISPANIC OR LATINO BY RACE". data.census.gov. Retrieved 15 June 2025.
- "P2HISPANIC OR LATINO, AND NOT HISPANIC OR LATINO BY RACE". data.census.gov. Retrieved 15 June 2025.
- "Race and Ethnicity in the United States: 2010 Census and 2020 Census". U.S. Census Bureau. Retrieved December 2, 2021.
- "DP05 – ACS Demographic and Housing Estimates". U.S. Census Bureau. Retrieved October 17, 2019.
{{cite web}}: CS1 maint: deprecated archival service (link) - "2020 Census Frequently Asked Questions About Race and Ethnicity".
- "2010 Census Demographic Profile Summary File" (PDF). U.S. Census Bureau. Retrieved August 25, 2017.
- "About Race". United States Census Bureau.
- "Revisions to the Standards for the Classification of Federal Data on Race and Ethnicity". The White House. Retrieved 14 July 2024.
- "Population Distribution by Race/Ethnicity". Kaiser Family Foundation. October 28, 2022.
- "Grid View: Table B02001 - Census Reporter". censusreporter.org. Retrieved 2024-06-28.
- "Grid View: Table B03002 - Census Reporter". censusreporter.org. Retrieved 2024-06-28.
- Hobbs, Frank; Stoops, Nicole (November 2002). "Demographic Trends in the 20th Century. Census 2000 Special Reports" (PDF). U.S. Census Bureau, U.S. Department of Commerce. pp. 56, 77.
- "National Population by Characteristics: 2020-2021". Census.gov. Retrieved 2022-06-30.
- Rico, Brittany; Jacobs, Paul; Coritz, Alli (1 June 2023). "2020 Census Shows Increase in Multiracial Population in All Age Categories". United States Census Bureau. Retrieved 28 December 2024.
- Schaeffer, Katherine (July 30, 2019). "The most common age among whites in U.S. is 58 – more than double that of racial and ethnic minorities". Pew Research Center.
- "ACS Demographic and Housing Estimates – 2011–2015". U.S. Census Bureau. Retrieved August 26, 2017.
{{cite web}}: CS1 maint: deprecated archival service (link) - "Grid View: Table B03002 - Census Reporter". censusreporter.org. Retrieved 2024-06-29.
- "American Samoa 2010 Demographic Profile". American FactFinder. Archived from the original on May 3, 2017. Retrieved July 1, 2020.
- "Guam 2010 Demographic Profile". American FactFinder. Archived from the original on April 13, 2016. Retrieved July 1, 2020.
- "Northern Mariana Islands 2010 Demographic Profile". American FactFinder. Archived from the original on November 6, 2018. Retrieved July 1, 2020.
- "The World Factbook: U.S. Virgin Islands". CIA. Archived from the original on January 13, 2021. Retrieved July 1, 2020.
- Patino, Marie (May 15, 2019). "U.S. Births Fell to Lowest Level in 32 Years in 2018". Bloomberg News.
- National Center for Education Statistics (February 2019). "Indicator 1: Population Distribution".
- Cohn, D'Vera (June 26, 2014). "Falloff in births slows shift to a majority-minority youth population". Pew Research Center.
- "About Hispanic Origin". U.S. Census Bureau. Retrieved August 26, 2017.
- "Overview of 2020 AIAN Redistricting Data: 2020" (PDF). Archived from the original (PDF) on January 26, 2022. Retrieved January 16, 2022.
- "A Look at the Largest American Indian and Alaska Native Tribes and Villages in the Nation, Tribal Areas and States". Census.gov. United States Census Bureau. Retrieved 2024-06-29.
- "Grid View: Table B02017 - Census Reporter". censusreporter.org. Retrieved 2024-06-29.
- "Grid View: Table B03002 - Census Reporter". censusreporter.org. Retrieved 2024-06-29.
- "Grid View: Table B02001 - Census Reporter". censusreporter.org. Retrieved 2024-06-29.
- "Federal Register" (PDF). Retrieved September 14, 2016.
- "Grid View: Table B02017 - Census Reporter". censusreporter.org. Retrieved 2024-06-29.
- "Grid View: Table B02019 - Census Reporter". censusreporter.org. Retrieved 2024-06-29.
- "Census profile: United States". Census Reporter. Retrieved September 23, 2025.
- Davenport, Christian (April 20, 2010). "A disconnect at Magruder". The Washington Post. Washington, DC. p. B1.
- "Who are America's veterans?". USAFacts. Retrieved 2026-05-18.
- "How is the standard of living changing for veterans?". USAFacts. Retrieved 2026-05-18.
- Hsu, Spencer S. (May 2, 2010). "Senate Democrats' plan highlights nation's shift to the right on immigration". The Washington Post. Washington, DC. p. A3.
- "How European and U.S. unauthorized immigrant populations compare". Pew Research Center. November 13, 2019. Retrieved 2020-01-07.
- "U.S. Unauthorized Immigrant Population Reached a Record 14 Million in 2023". Pew Research Center. August 21, 2025.
- "Grid View: Table B26103 - Census Reporter". censusreporter.org. Retrieved September 23, 2025.
- Beatty, Lauren G.; Snell, Tracy L. (December 2021). "SPECIAL REPORT - Prison Inmates: Profile of Prison Inmates, 2016" (PDF). US Department of Justice - Bureau of Justice Statistics. Retrieved September 23, 2025.
- Beatty, Lauren G.; Snell, Tracy L. (December 2021). "SPECIAL REPORT - Survey of Prison Inmates: Profile of Prison Inmates" (PDF). Ballotpedia. Retrieved September 23, 2025.
- Schneider, Mike (2024-11-07). "Questions about sexual orientation and gender ID on track to be on US Census Bureau survey by 2027". AP News. Retrieved 2025-09-18.
- Jones, Jeffrey M. (2025-02-20). "LGBTQ+ Identification in U.S. Rises to 9.3%". Gallup.com. Retrieved 2025-09-18.
- "DP1 | PROFILE OF GENERAL POPULATION AND HOSUING CHARACTERISTICS". United States Census Bureau. Retrieved 2026-05-28.
- "Over 820,000 married same-sex couples live in the U.S., double the number before Obergefell". Williams Institute. Retrieved 2025-09-18.
- "2023 National Population Projections Tables: Main Series". Census.gov. United States Census Bureau. Retrieved 2024-06-29.
- "U.S. Hispanic population to triple by 2050". USA Today. February 11, 2008.
- "2023 National Population Projections Tables: Main Series". Census.gov. United States Census Bureau. Retrieved 2024-06-29.
- "Methodology, Assumptions, and Inputs for the 2023 National Population Projections" (PDF). US Census Bureau. July 3, 2024.
- "The Population Estimates "Blended Base:" What it is and Why it Matters". CTData. 2024-05-08. Retrieved 2024-07-03.
- "Grid View: Table B02013 - Census Reporter". censusreporter.org. Retrieved 2024-07-04.
- "Census Bureau discusses new "blended base" methodology for annual Population Estimates - EconSpark". www.aeaweb.org. Retrieved 2024-07-04.
- "Grid View: Table B02001 - Census Reporter". censusreporter.org. Retrieved 2024-07-04.
- "2023 National Population Projections Tables: Main Series". Census.gov. United States Census Bureau. Retrieved 2024-06-29.
- "International Database (IDB)". U.S. Census Bureau. Retrieved June 27, 2022.
- Ohlemacher, Stephen (August 13, 2008). "White Americans no longer a majority by 2042". Associated Press. Archived from the original on August 24, 2008.
- Aizenman, N.C. (August 13, 2008). "U.S. to Grow Grayer, More Diverse". The Washington Post. Retrieved May 8, 2013.
- Passel, Jeffrey (February 11, 2008). "Immigration to Play Lead Role In Future U.S. Growth". Pew Research Center. Archived from the original on January 3, 2010. Retrieved May 8, 2013.
- "The Majority of American Babies Are Now Minorities". Bloomberg. July 25, 2015.
- "Births: Provisional Data for 2021" (PDF). Retrieved 10 July 2022.
- Cite error: The named reference
America 2023 t227was invoked but never defined (see the help page). - Cite error: The named reference
Press 2023 m067was invoked but never defined (see the help page). - Passel, Jeffrey S.; Conh, D'Vera (February 11, 2008). "U.S. Population Projections: 2005–2050". Pew Research Center.
- "United States Population 2018". World Population Review.
- "United Nations, Department of Economic and Social Affairs, Population Division (2019). World Population Prospects 2019". 2019. Archived from the original on June 15, 2020. Retrieved August 21, 2019.
- "Grid View: Table B04007 - Census Reporter". censusreporter.org. Retrieved 2024-07-01.
- "Grid View: Table B04006 - Census Reporter". censusreporter.org. Retrieved 2024-06-29.
- "Grid View: Table B03001 - Census Reporter". censusreporter.org. Retrieved 2024-06-29.
- "Grid View: Table B02018 - Census Reporter". censusreporter.org. Retrieved 2024-06-29.
- "Grid View: Table B02019 - Census Reporter". censusreporter.org. Retrieved 2024-06-30.
- "Grid View: Table B04004 - Census Reporter". censusreporter.org. Retrieved 2024-06-30.
- "Measuring Religion in Pew Research Center's American Trends Panel". Pew Research Center. 14 January 2021. Archived from the original on 8 February 2021. Retrieved 10 April 2025.
- Table No. 68. Religious Bodies – Selected Data (p. 59), "Statistical Abstract of the United States: 2004–2005 (tables 67–69)" (PDF). U.S. Census Bureau.
- "Statistical Abstract of the United States: 2004–2005 (tables 67–69)" (PDF). U.S. Census Bureau.
- Fahmy, Dalia (2018-07-31). "Americans are far more religious than adults in other wealthy nations". Pew Research Center. Retrieved 2025-04-10.
- "America's Changing Religious Landscape". Pew Forum on Religion & Public Life. Pew Research Center's Religion & Public Life Project. May 12, 2015. Retrieved October 9, 2016.
- "In U.S., Decline of Christianity Continues at Rapid Pace". Pew Forum on Religion & Public Life. October 17, 2019. Retrieved October 19, 2019.
- "Statistics on Religion in America Report". Pew Forum on Religion & Public Life.
- "Religious Landscape Study". Pew Research Center. Retrieved 2025-04-10.
- "American Baptist Association – Membership Data". Association of Religion Data Archives. Archived from the original on November 27, 2020. Retrieved August 1, 2019.
- "Summary of Denominational Statistics" (PDF). American Baptist Churches U.S.A. 2017.
- "AG Churches, Membership, Adherents and Ministers 1960–2018" (PDF). Assemblies of God USA.
- "Baptist Bible Fellowship International – Membership Data". Association of Religion Data Archives. Archived from the original on September 21, 2020. Retrieved October 28, 2019.
- "Baptist Missionary Association of America – Membership Data". Association of Religion Data Archives. Archived from the original on November 11, 2020. Retrieved August 23, 2019.
- Walton, Jeffrey (August 20, 2019). "Disciples of Christ Claim Distinction of Fastest Declining Church". Juicy Ecumenism. Retrieved 2019-11-14.
- "Church of the Brethren denominational membership falls below 100,000". Church of the Brethren Newsline. January 27, 2021. Retrieved March 9, 2021.
- "Churches Of Christ In The United States – Statistical Summary" (PDF). 21st Century Christian. Archived from the original (PDF) on July 29, 2020. Retrieved October 9, 2019.
- "Table of Statistics of the Episcopal Church From 2018 Parochial Reports" (PDF). Episcopal Church. 2018. Archived from the original (PDF) on September 5, 2019. Retrieved September 9, 2019.
- "ELCA Facts". Evangelical Lutheran Church in America. Archived from the original on September 25, 2016. Retrieved August 16, 2019.
- "About the EPC". Evangelical Presbyterian Church.
- "Greek Orthodox Archdiocese of America – Membership Data". Association of Religion Data Archives. Archived from the original on April 25, 2021. Retrieved September 17, 2019.
- "Rosters and Statistics". The Lutheran Church-Missouri Synod. November 2018. Retrieved 9 June 2019.
- "National Association of Free Will Baptists – Membership Data". Association of Religion Data Archives. Archived from the original on May 5, 2011. Retrieved September 21, 2019.
- "Statistics". Baptist World Alliance. Archived from the original on September 27, 2019.
- "Orthodox Church in America – Membership Data". Association of Religion Data Archives. Archived from the original on November 11, 2020. Retrieved October 17, 2019.
- "PCA Statistics Five Year Summary". PCA Administrative Committee.
- "Comparative Summaries of Statistics 2018" (PDF). Presbyterian Church USA. Archived from the original (PDF) on 2020-11-09. Retrieved 2019-06-03.
- "Comparative Summaries of Statistics 2020" (PDF). Presbyterian Church USA. Archived from the original (PDF) on 2021-04-23. Retrieved 2021-05-08.
- "Church Statistical Data". Reformed Church in America.
- "Catholics". Adherents.com. Archived from the original on October 3, 2003. Retrieved September 19, 2011.
- "Section 1. Population" (PDF). Statistical Abstract of the United States: 2004–2005. U.S. Census Bureau. p. 55. Retrieved June 29, 2008. (Table No. 67. Self-described religious identification of adult population: 1990 and 2001; data for 2001).
- "Southern Baptist Convention continues statistical decline, Floyd calls for rethinking ACP process". Baptist Press. June 4, 2020. Archived from the original on 3 August 2020. Retrieved 8 June 2020.
- "UMData". umdata.org. Archived from the original on 2020-11-25. Retrieved 2019-02-28.
- "2019 WELS Annual Report". Wisconsin Evangelical Lutheran Synod. Retrieved July 23, 2019.
- "By 2040, Islam will be second largest religion in US: Study". Hindustan Times. January 12, 2018.
- Kosmin, Barry A.; Keysar, Ariela (2009). "American Religious Identification Survey (ARIS) 2008" (PDF). Trinity College. Hartford, Connecticut, USA. Archived from the original (PDF) on April 7, 2009. Retrieved April 1, 2009.
- "Religion in America: U.S. Religious Data, Demographics and Statistics". Pew Research Center. Retrieved October 19, 2019.
- Leonhardt, David (12 June 2024). "The Force Shaping Western Politics". The New York Times. Archived from the original on 12 June 2024.
- "Place Of Birth For The Foreign-Born Population In The United States. Universe: Foreign-born population excluding population born at sea more information. 2017 American Community Survey 1-Year Estimates". United States Census Bureau. Retrieved August 6, 2019.
{{cite web}}: CS1 maint: deprecated archival service (link) - Alperin, Elijah; Batalova, Jeanne (1 August 2018). "European Immigrants in the United States – Immigration Pathways and Naturalization". Migration Policy Institute.
- "Immigrant and Emigrant Populations". Migration Policy Institute. 10 February 2014. Retrieved 24 July 2023.
- Radford, Jynnah (June 17, 2019). "Key findings about U.S. immigrants". Pew Research Center.
- "U.S. Unauthorized Immigrant Population Reached a Record 14 Million in 2023". Pew Research Center. August 21, 2025.
- Krogstad, Jens Manuel (October 7, 2019). "Key facts about refugees to the U.S." Pew Research Center.
- "New Population Estimates Show COVID-19 Pandemic Significantly Disrupted Migration Across Borders". Census.gov. Retrieved 2022-07-20.
- "Largest region-of-birth group of immigrants in US" (PDF). U.S. Census Bureau. Archived from the original (PDF) on February 9, 2015. Retrieved October 3, 2017.
- "Introduction: Immigration from Latin America and Caribbean". Harvard University. Archived from the original on 2019-02-28.
- "Table 3. Persons Obtaining Lawful Permanent Resident Status by Region and Country of Birth: Fiscal Years 2018 to 2020". Yearbook of Immigration Statistics. Department of Homeland Security. January 6, 2022. Retrieved 7 February 2021.
- "Frequently Requested Statistics on Immigrants and Immigration in the United States". Migration Policy Institute. March 14, 2019.
- "Table 1. Persons Obtaining Lawful Permanent Resident Status: Fiscal Years 1820 to 2018". Yearbook of Immigration Statistics. Department of Homeland Security. December 19, 2019. Retrieved 12 January 2020.
- "Yearbook 2021 | Homeland Security". www.dhs.gov. Retrieved 2022-12-14.
- "Table 6. Persons Obtaining Lawful Permanent Resident Status by Type and Major Class of Admission: Fiscal Years 2018 to 2020". Yearbook of Immigration Statistics. Department of Homeland Security. December 19, 2019. Retrieved 7 February 2022.
- "How Are We Counted?". American Citizens Abroad. April 2017. Retrieved 22 September 2019.
The Federal Voting Assistance Program (FVAP) estimates that there are 4.5 million to 6.5 million overseas Americans while the State Department's most recent calculation (April 2015) of US citizens living overseas is 8.7 million{...}US citizens living outside the US who are not employed by the US Government, including dependents living with them – Not counted in the census.
- Smith, Claire M. "These are our Numbers: Civilian Americans Overseas and Voter Turnout" (PDF). Overseas Vote Foundation. Archived from the original (PDF) on October 24, 2013. (Originally published in OVF Research Newsletter, vol. 2, issue 4, August 2010).
- Trow, Steve; Bruce, Charles (2007-03-26). "U.S. Citizens Who Don't Know It" (PDF). Legal Times. 30 (13). Archived from the original (PDF) on February 25, 2021. Retrieved 2014-11-03.
- Jaylinn Herrera (November 12, 2022). "More Americans are living and working in Mexico. Where does that leave the locals?". NBC News website.
- "Income and Poverty in the United States: 2020". Census.gov. Retrieved 2022-06-29.
- Semega, Jessica; Chen, Frances; Kollar, Melissa; Shrider, Emily A. "Income and Poverty in the United States: 2021" (PDF). US CENSUS BUREAU. Retrieved 19 September 2022.
- "Personal Income: PINC-03". US CENSUS BUREAU. Retrieved 29 June 2022.
- "Historical Income Tables: Households". US CENSUS BUREAU. Retrieved 29 June 2022.
- "S1501 – Educational Attainment". U.S. Census Bureau. Retrieved October 17, 2019.
{{cite web}}: CS1 maint: deprecated archival service (link) - "DP03 – Selected Economic Characteristics". U.S. Census Bureau. Retrieved October 17, 2019.
{{cite web}}: CS1 maint: deprecated archival service (link) - "Current Unemployment Rates for States and Historical Highs/Lows". U.S. Bureau of Labor Statistics.
- "Employment Situation Summary - 2025 M05 Results". Bureau of Labor Statistics. 2025-06-06. Retrieved 2025-06-26.
- "U.S. Bureau of Labor Statistics". Bureau of Labor Statistics. 2025-06-26. Retrieved 2025-06-26.
- "Seasonally Adjusted Unemployment Rate". U.S. Dept. of Labor. Retrieved September 19, 2016.
- "Employment Situation Summary". U.S. Dept. of Labor. July 2, 2015. Retrieved December 26, 2015.
- "Table A-15. Alternative measures of labor underutilization". U.S. Bureau of Labor. Retrieved November 13, 2011.
- Rickard, Stephanie J. (2020). "Economic Geography, Politics, and Policy". Annual Review of Political Science. 23: 187–202. doi:10.1146/annurev-polisci-050718-033649.
- Schuman, H. and Scott, J. (1989), Generations and collective memories, American Sociological Review, vol. 54, 1989, pp. 359–81.
- Britannica, T. Editors of Encyclopaedia. "Lost Generation." Encyclopedia Britannica, December 9, 2024. https://www.britannica.com/topic/Lost-Generation.
- Frommer, Fred (May 30, 2024). "Greatest Generation". Encyclopaedia Britannica. Retrieved February 4, 2025.
- Wallenfeldt, Jeff (October 9, 2024). "Silent Generation". Encyclopaedia Britannica. Retrieved February 4, 2025.
- Bump, P. (January 18, 2025). "baby boomer". Encyclopaedia Britannica. Retrieved February 4, 2025.
- Jackson, Ronald L. II, ed. (2010). Encyclopedia of Identity, Volume 1. Sage Publications. p. 307. ISBN 978-1-4129-5153-1.
- Alicja Zelazko (February 2, 2025). "Millennial". Encyclopaedia Britannica. Retrieved February 4, 2025.
- "Generation Z". Encyclopedia Britannica. Retrieved February 4, 2025.
- "Understanding Generation Alpha". McCrindle Research. 6 July 2022. Retrieved February 4, 2025.
- "Baby Boomers - Year Range, Definition & Facts". June 7, 2019.
- Tuttle, William M. (1993). "Daddy's Gone to War": The Second World War in the Lives of America's Children. Oxford University Press. p. 25. ISBN 978-0-195096491. Retrieved March 17, 2014.
- "Census Bureau Releases 2021 CPS ASEC Geographic Mobility Data". U.S. Census Bureau. Retrieved 2022-03-03.
- "Educational Attainment in the United States: 2022 | Table 2. Educational Attainment of the Population 25 Years and Over, by Selected Characteristics: 2022 - Both Sexes". United States Census Bureau. Retrieved July 23, 2025.
- "DP1 | PROFILE OF GENERAL POPULATION AND HOUSING CHARACTERISTICS". United States Census Bureau. Retrieved 2025-12-30.
- "DP04 | Selected Housing Characteristics". United States Census Bureau. Retrieved 2026-05-17.
- Olick, Diana (2024-12-18). "American homeowners are wasting more space than ever before". CNBC. Retrieved 2026-05-18.
- "2024: ACS 1-Year Estimates Detailed Tables | B25002 | Occupancy Status". United States Census Bureau. Retrieved 2025-12-30.
- "Explore Census Data". United States Census Bureau. Retrieved 2025-12-30.
- "B25002 | Occupancy Status". United States Census Bureau. Retrieved 2025-12-30.
- "B25002 | OCCUPANCY STATUS". United States Census Bureau. Retrieved 2025-12-30.
- "B25002 | OCCUPANCY STATUS". United States Census Bureau. Retrieved 2026-05-18.
- "B25002 | OCCUPANCY STATUS". United States Census Bureau. Retrieved 2026-05-21.
- US Census Bureau. "Using 1-Year or 5-Year American Community Survey Data". Census.gov. Retrieved 2026-05-21.
- "DP04 | SELECTED HOUSING CHARACTERISTICS - 2024: ACS 5-Year Estimates Data Profile". United States Census Bureau. Retrieved 2026-05-21.
- "DP04 | SELECTED HOUSING CHARACTERISTICS - 2023: ACS 5-Year Estimates Data Profile". United States Census Bureau. Retrieved 2026-05-21.
- "DP04 | SELECTED HOUSING CHARACTERISTICS - 2022: ACS 5-Year Estimates Data Profile". United States Census Bureau. Retrieved 2026-05-21.
- "DP04 | SELECTED HOUSING CHARACTERISTICS - 2021: ACS 5-Year Estimates Data Profile". United States Census Bureau. Retrieved 2026-05-21.
- "DP04 | SELECTED HOUSING CHARACTERISTICS - 2020: ACS 5-Year Estimates Data Profile". United States Census Bureau. Retrieved 2026-05-21.
- "DP04 | SELECTED HOUSING CHARACTERISTICS - 2019: ACS 5-Year Estimates Data Profile". United States Census Bureau. Retrieved 2026-05-21.
- "DP04 | SELECTED HOUSING CHARACTERISTICS". United States Census Bureau. Retrieved 2026-05-21.
- "DP04 | Selected Housing Characteristics - 2024: ACS 5-Year Estimates Data Profiles". United States Census Bureau. Retrieved 2026-05-28.
- "DP04 | Selected Housing Characteristics". United States Census Bureau. Retrieved 2026-05-28.
- "DP04 | Selected Housing Characteristics". United States Census Bureau. Retrieved 2026-05-28.
- "DP04 | Selected Housing Characteristics". United States Census Bureau. Retrieved 2026-05-28.
- "DP04 | SELECTED HOUSING CHARACTERISTICS". United States Census Bureau. Retrieved 2026-05-28.
- "Explore Census Data". data.census.gov. Retrieved 2026-05-28.
External links
External links
- United States Census Bureau
- New York Times: "Mapping the 2010 U.S. Census"
- 2000 Census of Population and Housing United States, U.S. Census Bureau
- Asian-Nation: Demographics of Asian American /2006-07-04-us-population_x.htm?csp=34 Countdown to 300 million
- Census Ancestry Map
- USA Today 2004 Election County by County Map
- Google – public data "Population in the U.S.A."