| Predicted Aligned Error | |
|---|---|
 | |
| Filename extension |
.json |
| Internet media type |
application/json |
| Developed by | DeepMind, EMBL-EBI |
| Type of format | Bioinformatics |
| Website | https://alphafold.ebi.ac.uk/faq |
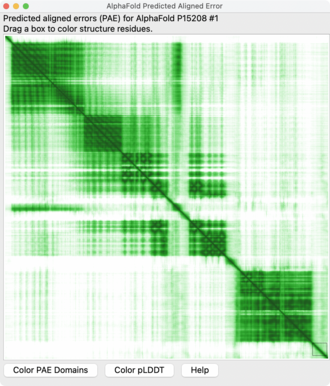
The Predicted Aligned Error (PAE) is a quantitative output produced by AlphaFold, a protein structure prediction system developed by DeepMind1, and other similar programs. During training, the aligned error between two residues, i and j is calculated by aligning the predicted N, Cα, and C atoms of residue i onto the same atoms in the experimental structure in the training data, and measuring the resulting distance between the predicted position of the Cα atom of residue j and the experimental position of that atom. The network is trained to calculate a probability distribution over the aligned error for each pair of residues from which the PAE for each pair can be calculated. Thus, the PAE estimates the expected positional error for each residue in a predicted protein structure given the alignment of the predicted structure onto the experimental structure on a different residue. This measurement helps scientists assess the confidence in the relative positions and orientations of different parts of the predicted protein model.2
Calculation and presentation
The AlphaFold2 and AlphaFold3 networks are trained to produce a probability distribution over the predicted aligned error in 64 bins, , such that bins 1-64 cover (0,0.5), (0.5,1.0),..., (31.0,31.5), (31.5-), where the last bin covers all distances larger than 31.5 Å. The sum over all 64 bins is 1.0:
The PAE is calculated by multiplying each probability by the center value of each bin and summing:
where .
PAE is presented as a two-dimensional (2D) interactive plot where the color at coordinates (x, y) represents the predicted position error at residue x if the predicted and true structures were aligned on residue y.3 Lower PAE values for residue pairs from different domains suggest well-defined relative positions and orientations in the prediction, while higher PAE values indicate uncertainty in the relative positions or orientations.
Users can download the raw PAE data for all residue pairs in a custom JSON format for further analysis or visualization using a programming language such as Python. The format of the JSON file is as follows:
[
    {
        "predicted_aligned_error": [[0, 1, 4, 7, 9, ...], ...],
        "max_predicted_aligned_error": 31.75
    }
]
In the JSON file, the field predicted_aligned_error provides the PAE value for each residue pair (rounded to the nearest integer), and the field max_predicted_aligned_error gives the maximum possible PAE value, which is capped at 31.75 Å. The PAE is measured in Ångströms.
A separately developed 3D viewer of PAE allows for more intuitive visualization.4

Interpretation
Interpretation of PAE values allows scientists to understand the level of confidence in the predicted structure of a protein: Lower PAE values between residue pairs from different domains indicate that the model predicts well-defined relative positions and orientations for those domains. Higher PAE values for such residue pairs suggest that the relative positions and/or orientations of these domains in the 3D structure are uncertain and should not be interpreted.5
Caveats
Although PAE provides valuable information, users should note that it is asymmetric; the PAE value for (x, y) may differ from the value for (y, x), particularly between loop regions with highly uncertain orientations.6 Moreover, while AlphaFold can make useful inter-domain predictions, intra-domain prediction accuracy is expected to be more reliable based on CASP14 validation.
Derived metrics for protein chains and protein complexes
For single protein chains or entire complexes, AlphaFold2 and AlphaFold3 calculate a predicted Template modeling score or from the probability distribution over aligned errors. It is calculated by aligning on each residues (i=1,L), one at a time, calculating the average value of the TM score equation over all residues in the structure, and taking the maximum of the TM averages:
where both and range over all residues in the structure, . is a scaling parameter fitted to ensure that the TM score is roughly flat as a function of structure size for unrelated proteins (~0.15)7 :
AlphaFold-Multimer introduced a score called (interface predicted Template Modeling score) to assess the predicted accuracy of protein complexes. Despite the name, is calculated over whole chains, not just interface residues.
Since PAE is asymmetric, can also be asymmetric. The asymmetric score is calculated by aligning on one residue at a time in one chain, calculating the average TM score for all the residues in the other chain, and taking the maximum over the TM averages:
The AlphaFold code calculates L as the sum of the length of the two protein chains and as . The output is simply the maximum over all possible alignments in both chains, or:
For a multi-protein complex, the maximum is taken over all residues in all chains (the set C) and the means are taken over all residues, j, not in the same chain as residue i, which is denoted . The value of L used to calculate is the sum of the lengths of all proteins in the complex:
Several other metrics for protein complexes have been derived from the PAE matrix (or the underlying probability distribution), including actifpTM8, pDockQ29, LIS10, and ipSAE11. The latter scores account for certain deficiencies in the original ipTM score, including equal weighting to ordered and disordered regions and scaling of PAEs by the size of the entire protein system11.
References
References
- "AlphaFold Protein Structure Database". alphafold.ebi.ac.uk. 2023-06-12. Archived from the original on 2023-06-13. Retrieved 2023-06-12.
- "AlphaFold Error Estimates". www.rbvi.ucsf.edu. Archived from the original on 2023-06-13. Retrieved 2023-06-12.
- "Enabling high-accuracy protein structure prediction at the proteome scale". www.deepmind.com. 2023-06-13. Archived from the original on 2023-06-13. Retrieved 2023-06-13.
- Elfmann, Christoph; Stülke, Jörg (2023-05-04). "PAE viewer: a webserver for the interactive visualization of the predicted aligned error for multimer structure predictions and crosslinks". Nucleic Acids Research. 51 (W1): W404–W410. doi:10.1093/nar/gkad350. ISSN 0305-1048. PMC 10320053. PMID 37140053.
- Varadi, Mihaly (2023-06-13). "NIH: National Library of Medicine: AlphaFold Database". Nucleic Acids Research. 50 (D1): D439–D444. doi:10.1093/nar/gkab1061. PMC 8728224. PMID 34791371.
- "Why is the Alphafold PAE (predicted aligned error) not symmetric?". Matter Modeling Stack Exchange. 2023-06-12. Archived from the original on 2023-06-13. Retrieved 2023-06-12.
- Zhang, Y; Skolnick, J (1 December 2004). "Scoring function for automated assessment of protein structure template quality". Proteins. 57 (4): 702–10. doi:10.1002/prot.20264. PMID 15476259.
- Varga, JK; Ovchinnikov, S; Schueler-Furman, O (4 March 2025). "actifpTM: a refined confidence metric of AlphaFold2 predictions involving flexible regions". Bioinformatics (Oxford, England). 41 (3) btaf107. doi:10.1093/bioinformatics/btaf107. PMC 11925850. PMID 40080667.
- Zhu, W; Shenoy, A; Kundrotas, P; Elofsson, A (1 July 2023). "Evaluation of AlphaFold-Multimer prediction on multi-chain protein complexes". Bioinformatics (Oxford, England). 39 (7) btad424. doi:10.1093/bioinformatics/btad424. PMC 10348836. PMID 37405868.
- Kim, AR; Hu, Y; Comjean, A; Rodiger, J; Mohr, SE; Perrimon, N (21 February 2024). "Enhanced Protein-Protein Interaction Discovery via AlphaFold-Multimer". bioRxiv 10.1101/2024.02.19.580970.
- Dunbrack, RL (14 February 2025). "Rēs ipSAE loquuntur: What's wrong with AlphaFold's ipTM score and how to fix it". bioRxiv 10.1101/2025.02.10.637595.