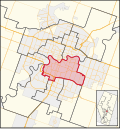
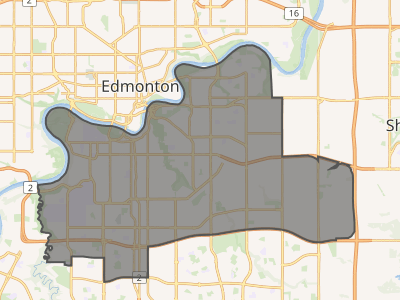
Edmonton Strathcona (formerly known as Edmonton—Strathcona ) is a federal electoral district in Alberta , Canada, that has been represented in the House of Commons of Canada since 1953. It spans the south-central part of the city of Edmonton . In the periods from 2008 to 2015 and 2019 to 2021, during the 40th , 41st , and 43rd Canadian Parliaments , Edmonton Strathcona was the only federal riding in Alberta not represented by the Conservative Party .
Geography
Edmonton Strathcona encompasses the neighbourhoods of Allendale, Argyll, Avonmore, Belgravia, Bonnie Doon, Capilano, Cloverdale, Empire Park, Forest Heights, Fulton Place, Garneau, Gold Bar, Grandview Heights, Hazeldean, Holyrood, Idylwylde, Kenilworth, King Edward Park, Lansdowne, Lendrum Place, Malmo Plains, McKernan, Ottewell, Parkallen, Pleasantview, Queen Alexandra Park, Ritchie, Riverdale , Strathcona, Strathearn, Terrace Heights, and Windsor Park.
The riding contains the historic district of Old Strathcona, the University of Alberta , the University of Alberta Campus Saint-Jean and the Mackenzie Health Sciences Centre .
It borders on the federal ridings of Edmonton Centre , Edmonton Griesbach , Sherwood Park—Fort Saskatchewan , Edmonton Southeast , Edmonton Gateway and Edmonton Riverbend .
This district is bounded:3
On the north by the North Saskatchewan River (except for a jog that goes around the neighbourhood of Riverdale, which is north of the river).
On the west by the Whitemud Creek from the North Saskatchewan River to Whitemud Drive.
On the south by Whitemud Drive, from Whitemud Creek to the City Limits.
On the east by Edmonton's City Limits.
Political geography
As evidenced by the 2008 and 2011 elections, this riding is heavily polarized between more urban New Democratic Party (NDP) voters concentrated in the northwest of the riding and suburban Conservative voters concentrated in the south and east.
The NDP picked up this seat in 2008 for the first time in its history, when Edmonton lawyer Linda Duncan defeated Tory incumbent Rahim Jaffer, thanks to a consolidation of non-Conservative votes. They have retained the riding since and it has established itself as clearly the most left-leaning riding in Alberta. Since the 2021 federal election, Edmonton-Strathcona has been the safest NDP seat in all of Canada.
Demographics
According to the 2011 Canadian census ; 2013 representation4 5 Languages: 77.3% English, 3.8% French, 3.5% Chinese, 2.5% German, 1.5% Ukrainian, 1.3% Spanish, 1.3% TagalogReligions: 52.8% Christian (22.1% Catholic, 5.6% United Church, 3.5% Lutheran, 3.5% Anglican, 2.2% Baptist, 2.0% Christian Orthodox, 1.1% Pentecostal, 13.0% Other), 2.5% Muslim, 1.2% Hindu, 1.1% Buddhist, 40.6% No religion Median income (2010): $35,026 Average income (2010): $46,710
Panethnic groups in Edmonton Strathcona (2011−2021)
Panethnic 20216
20167
20118
Pop.
%
Pop.
%
Pop.
%
European a 71,690
75,835
79,705
East Asian b 6,895
7,240
5,565
Indigenous
6,305
5,405
4,320
South Asian
4,855
4,150
2,825
Southeast Asian c 3,615
3,655
2,925
African
2,410
2,335
1,505
Middle Eastern d 2,180
1,955
1,840
Latin American
1,500
1,385
1,185
Other/Multiracial e
1,190
735
730
Total responses
100,635
102,695
100,585
Total population
102,188
106,066
103,183
Notes: Totals greater than 100% due to multiple origin responses.2012 Canadian federal electoral redistribution riding boundaries.
History
The Strathcona riding dates back to Territorial times (see Strathcona (federal electoral district) . It was represented by Liberal MPs, then a Liberal MP who after election became a Unionist, then became a Conservative), and a United Farmer of Alberta MP in that early incarnation. (This riding was abolished in 1924, and its area was split among the Edmonton East , Edmonton West and Vegreville ridings.)
The electoral district of Edmonton—Strathcona (later Edmonton Strathcona) was created in 1952 from Edmonton East and Edmonton West ridings.
Edmonton—Strathcona gained territory from Edmonton East and was renamed "Edmonton Strathcona" during the 2012 electoral redistribution .
Historical boundaries
1952 representation order
1966 representation order
1976 representation order
1987 representation order
1996 representation order
2003 representation order
2013 representation order
Members of Parliament
This riding has elected the following members of the House of Commons :
Current member of Parliament
The current member of Parliament is Heather McPherson of the New Democratic Party who was first elected in the 2019 federal election and re-elected in the 2021 federal election . Winning 61% of the district vote in 2021, McPherson holds the largest margin of victory among elected NDP MPs in the 44th parliament.
Election results
Vote share Year 0 0.1 0.2 0.3 0.4 0.5 0.6 0.7 1950 1960 1970 1980 1990 2000 2010 2020 2030 Liberal Conservative CCF/NDP Green People's PC Reform/Alliance National SC Election results in Edmonton—Strathcona and... Graph of election results in Edmonton—Strathcona, Edmonton Strathcona (minor parties that never got 2% of the vote or didn't run consistently are omitted) View
source data .
Vote share Year 0 0.1 0.2 0.3 0.4 0.5 0.6 0.7 2010 2013 2016 2019 2022 2025 Liberal Conservative NDP Green People's Election results in Edmonton Strathcona Graph of election results in Edmonton Strathcona (minor parties that never got 2% of the vote or didn't run consistently are omitted) View
source data .
2025 Canadian federal election
Party
Candidate
Votes
%
Expenditures
New Democratic Heather McPherson 28,027
46.96
–10.99
$113,792.42
Conservative Miles Berry
19,768
33.12
+6.35
$47,957.55
Liberal Ron Thiering
10,709
17.94
+8.92
$55,867.76
People's David Joel Wojtowicz
386
0.65
–3.87
$1,213.42
Green Atul Deshmukh
366
0.61
–0.64
none listed
Independent Graham Lettner
250
0.42
–
$5,125.91
Communist Christian Bourque
181
0.30
–
none listed
Total valid votes/expense limit
59,687 99.39 – $128,865.02
Total rejected ballots
364 0.61 +0.01
Turnout
60,051 72.00 +2.90
Eligible voters
83,404
New Democratic notional holdSwing
–8.67
Source: Elections Canada 9 10
2021 Canadian federal election
Party
Candidate
Votes
%
Expenditures
New Democratic Heather McPherson 31,690
60.68
+13.41
$84,100.08
Conservative Tunde Obasan
13,310
25.49
–11.58
$95,386.46
Liberal Hibo Mohamed
3,948
7.56
–4.06
$22,672.65
People's Wes Janke
2,366
4.53
+2.87
$4,252.77
Green Kelly Green
634
1.21
–0.82
none listed
Libertarian Malcolm Stinson
275
0.53
–
none listed
Total valid votes/expense limit
52,223 99.40 – $108,879.96
Total rejected ballots
317 0.60 +0.16
Turnout
52,540 69.10 –3.16
Eligible voters
76,037
New Democratic hold
Swing
+12.50
Source: Elections Canada 12 13
2019 Canadian federal election
Party
Candidate
Votes
%
Expenditures
New Democratic Heather McPherson 26,823
47.27
+3.31
$93,513.73
Conservative Sam Lilly
21,035
37.07
+5.79
$88,211.43
Liberal Eleanor Olszewski 6,592
11.62
–9.11
$90,837.85
Green Michael Kalmanovitch
1,152
2.03
–0.27
$8,919.41
People's Ian Cameron
941
1.66
–
$1,364.69
Communist Naomi Rankin 125
0.22
–
$496.07
Marxist–Leninist Dougal MacDonald
77
0.14
–0.03
none listed
Total valid votes/expense limit
56,745 99.56 – $106,353.94
Total rejected ballots
250 0.44 +0.05
Turnout
56,995 72.26 +1.27
Eligible voters
78,876
New Democratic hold
Swing
+4.55
Source: Elections Canada 14 15
2015 Canadian federal election
Party
Candidate
Votes
%
Expenditures
New Democratic Linda Duncan 24,446
43.96
–9.75
$87,241.42
Conservative Len Thom
17,395
31.28
–9.04
$36,812.49
Liberal Eleanor Olszewski 11,524
20.73
+17.87
$62,711.39
Green Jacob K. Binnema
1,278
2.30
–0.04
$1,924.74
Libertarian Malcolm Stinson
311
0.56
–
$1,599.80
Pirate Ryan Bromsgrove
201
0.36
–
$1,083.76
Rhinoceros Donovan Eckstrom
133
0.24
–
none listed
Independent Chris Jones
116
0.21
–
none listed
Independent Andrew Schurman
107
0.19
–
$455.26
Marxist–Leninist Dougal MacDonald
93
0.17
–0.02
none listed
Total valid votes/expense limit
55,604 99.61 – $208,715.39
Total rejected ballots
217 0.39 –
Turnout
55,821 70.99 –
Eligible voters
78,635
New Democratic hold
Swing
–0.35
Source: Elections Canada 16 17
Vote share Year 0 0.1 0.2 0.3 0.4 0.5 0.6 0.7 1950 1960 1970 1980 1990 2000 2010 2020 Liberal Conservative CCF/NDP Green PC Reform/Alliance National SC Election results in Edmonton—Strathcona Graph of election results in Edmonton—Strathcona (minor parties that never got 2% of the vote or didn't run consistently are omitted) View
source data .
2011 Canadian federal election
Party
Candidate
Votes
%
Expenditures
New Democratic Linda Duncan 26,093
53.55
+10.96
$83,591.54
Conservative Ryan Hastman
19,762
40.55
–1.05
$77,930.25
Liberal Matthew Sinclair
1,372
2.82
–6.25
$16,742.47
Green Andrew Fehr
1,119
2.30
–4.14
$217.58
Independent Kyle Murphy
206
0.42
–
$1,915.44
Marxist–Leninist Kevan Hunter
91
0.19
–0.12
none listed
Independent Christopher White
87
0.18
–
$880.11
Total valid votes/expense limit
48,730 99.75 – $84,504.87
Total rejected ballots
124 0.25 +0.04
Turnout
48,854 66.52 +3.66
Eligible voters
73,444
New Democratic hold
Swing
+6.01
Source: Elections Canada 19 20
2008 Canadian federal election
Party
Candidate
Votes
%
Expenditures
New Democratic Linda Duncan 20,103
42.58
+10.08
$70,896.93
Conservative Rahim Jaffer 19,640
41.60
–0.11
$77,743.57
Liberal Claudette Roy
4,279
9.06
–8.73
$71,903.46
Green Jane Thrall
3,040
6.44
+0.49
$3,801.05
Marxist–Leninist Kevan Hunter
147
0.31
+0.11
none listed
Total valid votes/expense limit
47,209 99.79 – $82,491.89
Total rejected ballots
99 0.21 –0.07
Turnout
47,308 62.86 –5.37
Eligible voters
75,254
New Democratic gain from Conservative
Swing
+5.09
Source: Elections Canada 21 22
2006 Canadian federal election
Party
Candidate
Votes
%
Expenditures
Conservative Rahim Jaffer 22,009
41.71
+2.31
$73,018.07
New Democratic Linda Duncan 17,153
32.51
+8.70
$54,446.98
Liberal Andy Hladyshevsky
9,391
17.80
–11.22
$72,479.99
Green Cameron Wakefield
3,139
5.95
–0.55
$1,326.47
Progressive Canadian Michael Fedeyko
582
1.10
–
none listed
Marijuana Dave Dowling
390
0.74
–0.33
none listed
Marxist–Leninist Kevan Hunter
106
0.20
–0.01
$15.75
Total valid votes/expense limit
52,770 99.72 – $77,836.93
Total rejected ballots
148 0.28 –0.03
Turnout
52,918 68.23 +2.57
Eligible voters
77,560
Conservative hold
Swing
+5.50
Source: Elections Canada 23 24
2004 Canadian federal election
Party
Candidate
Votes
%
Expenditures
Conservative Rahim Jaffer 19,089
39.40
–11.64
$65,390.20
Liberal Debby Carlson 14,057
29.01
–2.88
$67,437.17
New Democratic Minister Faust 11,535
23.81
+9.02
$44,181.99
Green Cameron Wakefield
3,146
6.49
–
$2,855.80
Marijuana Dave Dowling
519
1.07
–0.39
none listed
Marxist–Leninist Kevan Hunter
103
0.21
–0.08
$26.75
Total valid votes/expense limit
48,449 99.69 – $74,517.10
Total rejected ballots
150 0.31 –0.01
Turnout
48,599 65.66 +2.87
Eligible voters
74,014
Conservative hold
Swing
+7.26
Source: Elections Canada 25 26
2000 Canadian federal election
Party
Candidate
Votes
%
Expenditures
Alliance Rahim Jaffer 23,463
42.00
+0.70
$57,365
Liberal Jonathan Dai
17,816
31.90
–3.49
$48,430
New Democratic Hélène Lortie-Narayana
8,256
14.78
+0.25
$25,883
Progressive Conservative Gregory Toogood
5,047
9.04
+1.79
$4,252
Marijuana Ken Kirk
814
1.46
–
$149
Canadian Action Kesa Rose Semenchuk
299
0.54
+0.35
$1,485
Marxist–Leninist Kevan Hunter
164
0.29
–
$275
Total valid votes
55,859 99.68
Total rejected ballots
182 0.32 +0.12
Turnout
56,041 62.79 +0.05
Eligible voters
89,248
Alliance hold
Swing
+2.10
Source: Elections Canada 27 28
1997 Canadian federal election
Party
Candidate
Votes
%
Expenditures
Reform Rahim Jaffer 20,605
41.30
+1.97
$58,003
Liberal Ginette Rodger
17,654
35.39
–3.13
$58,244
New Democratic Jean McBean
7,251
14.53
+9.48
$42,936
Progressive Conservative Edo Nyland
3,614
7.24
–4.06
$10,183
Green Karina Gregory
406
0.81
+0.24
$520
Natural Law Maury Shapka
153
0.31
–0.27
none listed
Independent Naomi Rankin 115
0.23
+0.05
$1,732
Canadian Action J. Alex Ford
92
0.18
–
$845
Total valid votes
49,890 99.80
Total rejected ballots
101 0.20 –0.02
Turnout
49,991 62.74 –2.11
Eligible voters
79,680
Reform hold
Swing
+2.55
Source: Elections Canada 29 30
See also
See also
Notes
Notes
Statistic includes all persons that did not make up part of a visible minority or an indigenous identity.
Statistic includes total responses of "Chinese", "Korean", and "Japanese" under visible minority section on census.
Statistic includes total responses of "Filipino" and "Southeast Asian" under visible minority section on census.
Statistic includes total responses of "West Asian" and "Arab" under visible minority section on census.
Statistic includes total responses of "Visible minority, n.i.e. " and "Multiple visible minorities" under visible minority section on census.
The Reform Party merged with the Canadian Alliance on 27 March 2000.
The Canadian Alliance merged with the Progressive Conservatives to form the Conservative Party on 8 December 2003.
References
References
Statistics Canada : 2011
Statistics Canada : 2011
"History of Federal Ridings since 1867" . Parliament of Canada. Retrieved March 27, 2011 .
"2011 Census Profile" . February 8, 2012.
"Statistics Canada: 2011 National Household Survey Profile" . May 8, 2013.
Government of Canada, Statistics Canada (October 26, 2022). "Census Profile, 2021 Census of Population" . www12.statcan.gc.ca . Retrieved April 1, 2023 .
Government of Canada, Statistics Canada (October 27, 2021). "Census Profile, 2016 Census" . www12.statcan.gc.ca . Retrieved April 1, 2023 .
Government of Canada, Statistics Canada (November 27, 2015). "NHS Profile" . www12.statcan.gc.ca . Retrieved April 1, 2023 .
"Forty-Fifth General Election 2025 — Poll-by-poll Results: Edmonton Strathcona" . elections.ca . Elections Canada . 2025.
Canada, Chief Electoral Officer (2025). "Candidate Campaign Returns, 2025 General Election: Part 3C – Summary of Electoral Campaign Expenses and Other Outflows – Election expenses subject to the limit – Total" . elections.ca . Elections Canada . Expenses are reported "as amended" where amendments have been filed; otherwise, they are reported "as submitted".
"Transposition of Votes from the 44th General Election to the 2023 Representation Orders" . Elections Canada . Retrieved April 9, 2024 .
"Forty-Fourth General Election 2021 — Poll-by-poll Results: Edmonton Strathcona" . elections.ca . Elections Canada . 2021.
Canada, Chief Electoral Officer (2021). "Candidate Campaign Returns, 2021 General Election: Part 3C – Summary of Electoral Campaign Expenses and Other Outflows – Election expenses subject to the limit – Total" . elections.ca . Elections Canada . Expenses are reported "as amended" where amendments have been filed; otherwise, they are reported "as submitted".
"Forty-Third General Election 2019 — Poll-by-poll Results: Edmonton Strathcona" . elections.ca . Elections Canada . 2019.
Canada, Chief Electoral Officer (2019). "Candidate Campaign Returns, 2019 General Election: Part 3C – Summary of Electoral Campaign Expenses and Other Outflows – Election expenses subject to the limit – Total" . elections.ca . Elections Canada . Expenses are reported "as amended" where amendments have been filed; otherwise, they are reported "as submitted".
"Forty-Second General Election 2015 — Poll-by-poll Results: Edmonton Strathcona" . elections.ca . Elections Canada . 2015.
Canada, Chief Electoral Officer (2015). "Candidate Campaign Returns, 2015 General Election: Part 4 – Campaign Financial Summary – Total election expenses subject to the limit" . elections.ca . Elections Canada . Expenses are reported "as amended" where amendments have been filed; otherwise, they are reported "as submitted".
Pundits' Guide to Canadian Elections
"Forty-First General Election 2011 — Poll-by-poll Results: Edmonton—Strathcona" . elections.ca . Elections Canada . 2011.
Canada, Chief Electoral Officer (2011). "Candidate Campaign Returns, 2011 General Election: Part 4 – Campaign Financial Summary – Total election expenses subject to the limit" . elections.ca . Elections Canada . Expenses are reported "as amended" where amendments have been filed; otherwise, they are reported "as submitted".
"Fortieth General Election 2008 — Poll-by-poll Results: Edmonton—Strathcona" . elections.ca . Elections Canada . 2008.
Canada, Chief Electoral Officer (2008). "Candidate Campaign Returns, 2008 General Election: Part 4 – Campaign Financial Summary – Total election expenses subject to the limit" . elections.ca . Elections Canada . Expenses are reported "as amended" where amendments have been filed; otherwise, they are reported "as submitted".
"Thirty-Ninth General Election 2006 — Poll-by-poll Results: Edmonton—Strathcona" . elections.ca . Elections Canada . 2006.
Canada, Chief Electoral Officer (2006). "Candidate Campaign Returns, 2006 General Election: Part 4 – Campaign Financial Summary – Total election expenses subject to the limit" . elections.ca . Elections Canada . Expenses are reported "as amended" where amendments have been filed; otherwise, they are reported "as submitted".
"Thirty-Eighth General Election 2004 — Poll-by-poll Results: Edmonton—Strathcona" . elections.ca . Elections Canada . 2004.
Canada, Chief Electoral Officer (2004). "Candidate Campaign Returns, 2004 General Election: Part 4 – Campaign Financial Summary – Total election expenses subject to the limit" . elections.ca . Elections Canada . Expenses are reported "as amended" where amendments have been filed; otherwise, they are reported "as submitted".
Canada, Library of Parliament (2026). "Elections and Ridings: Edmonton--Strathcona, Alberta (2000)" . lop.parl.ca .
Canada, Chief Electoral Officer (2000). Thirty-Seventh General Election, 2000: Official Voting Results (Report). Ottawa: Elections Canada . ISBN 0-662-65518-4
Canada, Library of Parliament (2026). "Elections and Ridings: Edmonton--Strathcona, Alberta (1997)" . lop.parl.ca .
Canada, Chief Electoral Officer (1997). Thirty-Sixth General Election, 1997: Official Voting Results (Report). Ottawa: Elections Canada .
Canada, Library of Parliament (2026). "Elections and Ridings: Edmonton--Strathcona, Alberta (1993)" . lop.parl.ca .
Canada, Chief Electoral Officer (1993). Thirty-Fifth General Election, 1993: Official Voting Results (Report). Ottawa: Elections Canada . ISBN 0-662-60097-5
Canada, Chief Electoral Officer (1993). Thirty-Fifth General Election, 1993: Contributions and Expenses of Registered Political Parties and Candidates (Report). Ottawa: Elections Canada . ISBN 0-662-61265-5
Canada, Library of Parliament (2026). "Elections and Ridings: Edmonton--Strathcona, Alberta (1988)" . lop.parl.ca .
Canada, Chief Electoral Officer (1988). Thirty-Fourth General Election, 1988: Report of the Chief Electoral Officer (Report). Ottawa: Elections Canada . ISBN 0-662-56648-3
Canada, Chief Electoral Officer (1988). Thirty-Fourth General Election, 1988: Report of the Chief Electoral Officer - Respecting Election Expenses (Report). Ottawa: Elections Canada . ISBN 0-662-56925-3
Canada, Library of Parliament (2026). "Elections and Ridings: Edmonton--Strathcona, Alberta (1984)" . lop.parl.ca .
Canada, Chief Electoral Officer (1984). Thirty-Third General Election, 1984: Report of the Chief Electoral Officer (Report). Ottawa: Queen's Printer. ISBN 0-662-53477-8
Canada, Chief Electoral Officer (1984). Thirty-Third General Election, 1984: Report of the Chief Electoral Officer - Respecting Election Expenses (Report). Ottawa: Queen's Printer. ISBN 0-662-53472-7
Canada, Library of Parliament (2026). "Elections and Ridings: Edmonton--Strathcona, Alberta (1980)" . lop.parl.ca .
Canada, Chief Electoral Officer (1980). Thirty-Second General Election, 1980: Report of the Chief Electoral Officer (Report). Ottawa: Queen's Printer. ISBN 0-660-50630-0
Canada, Chief Electoral Officer (1980). Thirty-Second General Election, 1980: Report of the Chief Electoral Officer - Respecting Election Expenses (Report). Ottawa: Queen's Printer. ISBN 0-662-51248-0
Canada, Library of Parliament (2026). "Elections and Ridings: Edmonton--Strathcona, Alberta (1979)" . lop.parl.ca .
Canada, Chief Electoral Officer (1979). Thirty-First General Election, 1979: Report of the Chief Electoral Officer (Report). Ottawa: Queen's Printer. ISBN 0-660-50445-6
Canada, Chief Electoral Officer (1979). Thirty-First General Election, 1979: Report of the Chief Electoral Officer - Respecting Election Expenses (Report). Ottawa: Queen's Printer. ISBN 0-662-50834-3
Canada, Library of Parliament (2026). "Elections and Ridings: Edmonton--Strathcona, Alberta (1974)" . lop.parl.ca .
Canada, Chief Electoral Officer (1974). Thirtieth General Election, 1974: Report of the Chief Electoral Officer (Report). Ottawa: Queen's Printer.
Canada, Library of Parliament (2026). "Elections and Ridings: Edmonton--Strathcona, Alberta (1972)" . lop.parl.ca .
Canada, Chief Electoral Officer (1972). Twenty-Ninth General Election, 1972: Report of the Chief Electoral Officer (Report). Ottawa: Queen's Printer.
Canada, Library of Parliament (2026). "Elections and Ridings: Edmonton--Strathcona, Alberta (1968)" . lop.parl.ca .
Canada, Chief Electoral Officer (1968). Twenty-Eighth General Election, 1968: Report of the Chief Electoral Officer (Report). Ottawa: Queen's Printer. hdl :2027/umn.31951d013775853
Canada, Library of Parliament (2026). "Elections and Ridings: Edmonton--Strathcona, Alberta (1965)" . lop.parl.ca .
Canada, Chief Electoral Officer (1965). Twenty-Seventh General Election, 1965: Report of the Chief Electoral Officer (Report). Ottawa: Queen's Printer. hdl :2027/umn.31951d013775845
Canada, Library of Parliament (2026). "Elections and Ridings: Edmonton--Strathcona, Alberta (1963)" . lop.parl.ca .
Canada, Chief Electoral Officer (1963). Twenty-Sixth General Election, 1963: Report of the Chief Electoral Officer (Report). Ottawa: Queen's Printer. hdl :2027/umn.31951d013775837
Canada, Library of Parliament (2026). "Elections and Ridings: Edmonton--Strathcona, Alberta (1962)" . lop.parl.ca .
Canada, Chief Electoral Officer (1962). Twenty-Fifth General Election, 1962: Report of the Chief Electoral Officer (Report). Ottawa: Queen's Printer. hdl :2027/uc1.a0004484481
Canada, Library of Parliament (2026). "Elections and Ridings: Edmonton--Strathcona, Alberta (1958)" . lop.parl.ca .
Canada, Chief Electoral Officer (1958). Twenty-Fourth General Election, 1958: Report of the Chief Electoral Officer (Report). Ottawa: Queen's Printer.
Canada, Library of Parliament (2026). "Elections and Ridings: Edmonton--Strathcona, Alberta (1957)" . lop.parl.ca .
Canada, Chief Electoral Officer (1957). Twenty-Third General Election, 1957: Report of the Chief Electoral Officer (Report). Ottawa: Queen's Printer. hdl :2027/mdp.39015061584382
Canada, Library of Parliament (2026). "Elections and Ridings: Edmonton--Strathcona, Alberta (1953)" . lop.parl.ca .
Canada, Chief Electoral Officer (1953). Twenty-Second General Election, 1953: Report of the Chief Electoral Officer (Report). Ottawa: Queen's Printer.
External links
External links
53°31′N 113°29′W / 53.52°N 113.48°W / 53.52; -113.48
 1952 representation order
 1966 representation order
 1976 representation order
 1987 representation order
 1996 representation order
 2003 representation order
 2013 representation order