Cotignac
Cotinhac (Occitan) | |
|---|---|
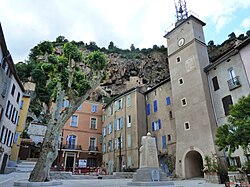 The village square in Cotignac | |
 Coat of arms | |
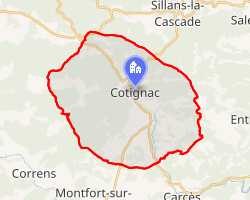 Location of Cotignac | |
Cotignac Cotignac | |
| Coordinates: 43°31′47″N 6°09′00″E / 43.5297°N 6.150000°E / 43.5297; 6.150000 | |
| Country | France |
| Region | Provence-Alpes-Côte d'Azur |
| Department | Var |
| Arrondissement | Brignoles |
| Canton | Brignoles |
| Intercommunality | CA Provence Verte |
| Government | |
| • Mayor (2020–2026) | Jean-Pierre Veran1 |
Area 1 | 44.26 km2 (17.09 sq mi) |
| Population (2023)2 | 2,197 |
| • Density | 49.64/km2 (128.6/sq mi) |
| Demonym | Cotignacéens |
| Time zone | UTC+01:00 (CET) |
| • Summer (DST) | UTC+02:00 (CEST) |
| INSEE/Postal code | 83046 /83570 |
| Elevation | 144–712 m (472–2,336 ft) (avg. 230 m or 750 ft) |
| Website | mairiecotignac |
| 1 French Land Register data, which excludes lakes, ponds, glaciers > 1 km2 (0.386 sq mi or 247 acres) and river estuaries. | |
Cotignac (French pronunciation: [kɔtiɲak]; Occitan: Cotinhac) is a commune in the Var department in the Provence-Alpes-Côte d'Azur region in southeastern France. It is a member of the association Les Plus Beaux Villages de France (The Most Beautiful Villages of France).
Geography
Climate
Cotignac has a hot-summer Mediterranean climate (Köppen climate classification Csa). The average annual temperature in Cotignac is 13.1 °C (55.6 °F). The average annual rainfall is 820.6 mm (32.31 in) with October as the wettest month. The temperatures are highest on average in July, at around 22.2 °C (72.0 °F), and lowest in January, at around 5.3 °C (41.5 °F). The highest temperature ever recorded in Cotignac was 40.6 °C (105.1 °F) on 7 July 1982; the coldest temperature ever recorded was −13.4 °C (7.9 °F) on 23 January 1963.
| Climate data for Cotignac (1981−2010 normals, extremes 1957−2013) | |||||||||||||
|---|---|---|---|---|---|---|---|---|---|---|---|---|---|
| Month | Jan | Feb | Mar | Apr | May | Jun | Jul | Aug | Sep | Oct | Nov | Dec | Year |
| Record high °C (°F) | 24.0 (75.2) |
23.6 (74.5) |
25.6 (78.1) |
28.6 (83.5) |
33.0 (91.4) |
38.0 (100.4) |
40.6 (105.1) |
39.4 (102.9) |
34.4 (93.9) |
31.6 (88.9) |
24.4 (75.9) |
22.2 (72.0) |
40.6 (105.1) |
| Mean daily maximum °C (°F) | 10.8 (51.4) |
11.9 (53.4) |
15.2 (59.4) |
17.7 (63.9) |
22.2 (72.0) |
26.6 (79.9) |
30.4 (86.7) |
30.2 (86.4) |
25.2 (77.4) |
19.8 (67.6) |
14.3 (57.7) |
11.2 (52.2) |
19.7 (67.5) |
| Daily mean °C (°F) | 5.3 (41.5) |
6.0 (42.8) |
8.7 (47.7) |
11.1 (52.0) |
15.3 (59.5) |
19.1 (66.4) |
22.2 (72.0) |
22.1 (71.8) |
18.1 (64.6) |
13.9 (57.0) |
9.0 (48.2) |
6.1 (43.0) |
13.1 (55.6) |
| Mean daily minimum °C (°F) | −0.1 (31.8) |
0.0 (32.0) |
2.1 (35.8) |
4.6 (40.3) |
8.3 (46.9) |
11.7 (53.1) |
14.1 (57.4) |
14.1 (57.4) |
11.0 (51.8) |
8.0 (46.4) |
3.7 (38.7) |
1.0 (33.8) |
6.6 (43.9) |
| Record low °C (°F) | −13.4 (7.9) |
−12.6 (9.3) |
−11.8 (10.8) |
−4.8 (23.4) |
−2.6 (27.3) |
3.2 (37.8) |
5.0 (41.0) |
5.0 (41.0) |
2.0 (35.6) |
−4.4 (24.1) |
−7.4 (18.7) |
−10.0 (14.0) |
−13.4 (7.9) |
| Average precipitation mm (inches) | 69.2 (2.72) |
43.6 (1.72) |
46.3 (1.82) |
82.3 (3.24) |
77.4 (3.05) |
50.1 (1.97) |
19.3 (0.76) |
48.5 (1.91) |
89.0 (3.50) |
109.1 (4.30) |
103.6 (4.08) |
82.2 (3.24) |
820.6 (32.31) |
| Average precipitation days (≥ 1.0 mm) | 6.4 | 5.2 | 5.2 | 7.7 | 6.8 | 4.9 | 2.7 | 3.7 | 5.3 | 7.4 | 6.8 | 6.7 | 68.7 |
| Source: Météo-France3 | |||||||||||||
Population
Inhabitants are known in French as Cotignacéens (masculine) and Cotignacéennes (feminine).
| Year | Pop. | ±% p.a. |
|---|---|---|
| 1968 | 1,398 | — |
| 1975 | 1,636 | +2.27% |
| 1982 | 1,628 | −0.07% |
| 1990 | 1,792 | +1.21% |
| 1999 | 2,026 | +1.37% |
| 2007 | 2,163 | +0.82% |
| 2012 | 2,313 | +1.35% |
| 2017 | 2,163 | −1.33% |
| 2023 | 2,197 | +0.26% |
| Source: INSEE4 | ||
References
References
- "Répertoire national des élus: les maires" (in French). data.gouv.fr, Plateforme ouverte des données publiques françaises. 13 September 2022.
- "Populations de référence 2023" (in French). National Institute of Statistics and Economic Studies. 18 December 2025.
- "Fiche Climatologique Statistiques 1981-2010 et records" (PDF) (in French). Météo-France. Retrieved 9 September 2022.
- Population municipale entre 1968 et 2023, INSEE.