Alzon | |
|---|---|
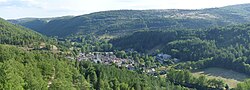 A general view of Alzon | |
 Coat of arms | |
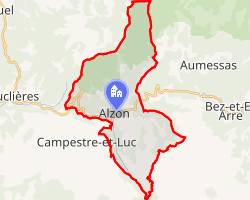 Location of Alzon | |
Alzon Alzon | |
| Coordinates: 43°58′04″N 3°26′25″E / 43.9678°N 3.4403°E / 43.9678; 3.4403 | |
| Country | France |
| Region | Occitania |
| Department | Gard |
| Arrondissement | Le Vigan |
| Canton | Le Vigan |
| Intercommunality | Pays Viganais |
| Government | |
| • Mayor (2020–2026) | Roger Laurens1 |
Area 1 | 27.48 km2 (10.61 sq mi) |
| Population (2023)2 | 194 |
| • Density | 7.06/km2 (18.3/sq mi) |
| Time zone | UTC+01:00 (CET) |
| • Summer (DST) | UTC+02:00 (CEST) |
| INSEE/Postal code | 30009 /30770 |
| Elevation | 502–1,414 m (1,647–4,639 ft) (avg. 600 m or 2,000 ft) |
| 1 French Land Register data, which excludes lakes, ponds, glaciers > 1 km2 (0.386 sq mi or 247 acres) and river estuaries. | |
Alzon (French pronunciation: [alzɔ̃]) is a commune in the Gard department in southern France.
The commune is located in the south of the Cévennes National Park, in the upper Vis river valley.
Geography
Climate
Alzon has an oceanic climate (Köppen climate classification Cfb) closely bordering on a warm-summer Mediterranean climate (Csb). The average annual temperature in Alzon is 11.5 °C (52.7 °F). The average annual rainfall is 1,372.8 mm (54.05 in) with November as the wettest month. The temperatures are highest on average in July, at around 20.1 °C (68.2 °F), and lowest in January, at around 4.0 °C (39.2 °F). The highest temperature ever recorded in Alzon was 39.3 °C (102.7 °F) on 28 June 2019; the coldest temperature ever recorded was −13.4 °C (7.9 °F) on 1 March 2005.
| Climate data for Alzon (1991−2020 normals, extremes 1998−present) | |||||||||||||
|---|---|---|---|---|---|---|---|---|---|---|---|---|---|
| Month | Jan | Feb | Mar | Apr | May | Jun | Jul | Aug | Sep | Oct | Nov | Dec | Year |
| Record high °C (°F) | 21.2 (70.2) |
23.4 (74.1) |
25.5 (77.9) |
29.0 (84.2) |
32.9 (91.2) |
39.3 (102.7) |
37.2 (99.0) |
39.2 (102.6) |
32.3 (90.1) |
29.2 (84.6) |
24.4 (75.9) |
21.2 (70.2) |
39.3 (102.7) |
| Mean daily maximum °C (°F) | 7.9 (46.2) |
9.0 (48.2) |
12.7 (54.9) |
15.8 (60.4) |
19.8 (67.6) |
24.7 (76.5) |
27.3 (81.1) |
27.1 (80.8) |
22.5 (72.5) |
17.2 (63.0) |
11.5 (52.7) |
8.3 (46.9) |
17.0 (62.6) |
| Daily mean °C (°F) | 4.0 (39.2) |
4.3 (39.7) |
7.3 (45.1) |
10.2 (50.4) |
13.8 (56.8) |
17.8 (64.0) |
20.1 (68.2) |
19.8 (67.6) |
16.0 (60.8) |
12.5 (54.5) |
7.5 (45.5) |
4.5 (40.1) |
11.5 (52.7) |
| Mean daily minimum °C (°F) | 0.2 (32.4) |
−0.3 (31.5) |
2.0 (35.6) |
4.6 (40.3) |
7.7 (45.9) |
10.9 (51.6) |
12.9 (55.2) |
12.5 (54.5) |
9.5 (49.1) |
7.7 (45.9) |
3.5 (38.3) |
0.6 (33.1) |
6.0 (42.8) |
| Record low °C (°F) | −12.2 (10.0) |
−13.1 (8.4) |
−13.4 (7.9) |
−6.0 (21.2) |
−2.4 (27.7) |
1.4 (34.5) |
3.0 (37.4) |
3.8 (38.8) |
−0.7 (30.7) |
−4.6 (23.7) |
−9.9 (14.2) |
−12.8 (9.0) |
−13.4 (7.9) |
| Average precipitation mm (inches) | 129.4 (5.09) |
84.3 (3.32) |
101.7 (4.00) |
132.2 (5.20) |
102.0 (4.02) |
68.7 (2.70) |
38.3 (1.51) |
61.1 (2.41) |
131.2 (5.17) |
188.9 (7.44) |
195.5 (7.70) |
139.5 (5.49) |
1,372.8 (54.05) |
| Average precipitation days (≥ 1.0 mm) | 11.3 | 8.8 | 9.7 | 10.7 | 9.2 | 6.6 | 5.0 | 5.8 | 6.7 | 11.7 | 11.6 | 11.8 | 108.8 |
| Source: Météo-France3 | |||||||||||||
Population
| Year | Pop. | ±% p.a. |
|---|---|---|
| 1968 | 280 | — |
| 1975 | 237 | −2.35% |
| 1982 | 201 | −2.33% |
| 1990 | 183 | −1.17% |
| 1999 | 208 | +1.43% |
| 2007 | 222 | +0.82% |
| 2012 | 204 | −1.68% |
| 2017 | 177 | −2.80% |
| 2023 | 194 | +1.54% |
| Source: INSEE4 | ||
Sights
References
References
- "Répertoire national des élus: les maires". data.gouv.fr, Plateforme ouverte des données publiques françaises (in French). 2 December 2020.
- "Populations de référence 2023" (in French). National Institute of Statistics and Economic Studies. 18 December 2025.
- "Fiche Climatologique Statistiques 1991-2020 et records" (PDF). Météo-France. Retrieved 25 August 2022.
- Population municipale entre 1968 et 2023, INSEE