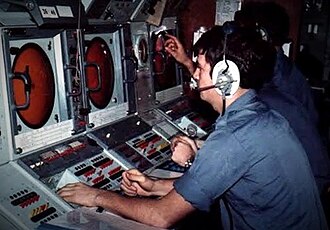
In naval terminology, a plot is a graphic display that shows all collated data from a ship's on-board sensors, i.e. radar, sonar and EW systems. They also displayed information from external sources - for example, other vessel or aircraft reports. There are four different types of plot, each with varying capabilities, i.e. range, depending on their role;1
- Air plot: Used for tracking air contacts, i.e. planes and EW information.
- Surface plot: Used for tracking contacts on the surface of the water, i.e. other ships.234 It can also perform a variety of roles such as:
- Providing a trace of a ship's own course and speed over time.24
- Plotting the position of a man overboard.2
- Can be used in naval gunfire support missions to plot unidentified contacts and keep track of friendly forces.3
- It also plays an important part in anti-submarine warfare operations and using torpedoes.3
- Sub-surface plot: Used for tracking contacts below the surface of the water, i.e. submarines.
- General operations plot: Used for tracking shipping on a large-scale chart. Was also used to display exercise boundaries, airplanes and other significant features of maritime interest. In the Royal Australian Navy, the scale used was generally 5 or 10 miles (8.0 or 16.1 km) per 1 inch (25 mm).
Notes
Notes
- Friedman, Norman (2006). Naval Institute Guide to World Naval Weapon Systems (Naval Institute Guide to World Naval Weapons Systems). US Naval Institute Press. p. 85. ISBN 1-55750-262-5. Retrieved 2008-12-11.
- Federation of American Scientists. "INFORMATION SHEET". www.fas.org. Retrieved 2008-12-11.
- NAVAL ORDNANCE AND GUNNERY VOLUME 2, FIRE CONTROL (1958). "CHAPTER-16-G". www.eugeneleeslover.com. Retrieved 2008-12-11.
{{cite web}}: CS1 maint: numeric names: authors list (link) - United States Navy. "Radar Bulletin No. 6, (RADSIX), CIC Manual". www.history.navy.mil. Archived from the original on July 12, 2006. Retrieved 2008-12-11.