The Pitztal is an alpine valley located in Tyrol, Austria.1 The Pitztal is a southern side valley of the Upper Inntal, and runs between the valleys Ötztal (to the east) and Kaunertal (to the west).1 The Pitze river runs the length of the valley and flows into the Rifflsee lake (2,232 m; 7,323 ft) west of the upper course; its average rate of flow is 2.7 m3/s (95 cu ft/s). The uppermost section of the river produces the Gries waterfall.1
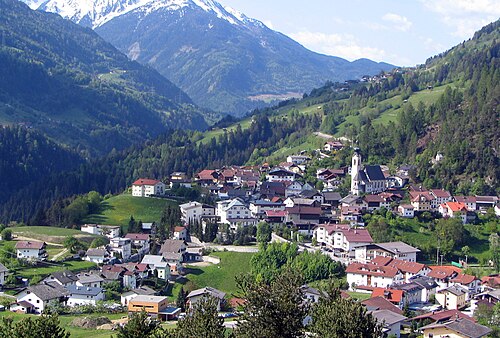
The primary economic activity of the valley is agriculture and tourism. One of the main attractions of the valley is the Pitztal underground funicular, which takes passengers from Mittelberg (1,736 m; 5,696 ft) to Mittelbergferner mountain (2,841 m; 9,321 ft).1 Important villages in the valley include Wenns (962 m; 3,156 ft), Sankt Leonhard im Pitztal (1,366 m; 4,482 ft), and Arzl im Pitztal (880 m; 2,890 ft).1
Climate
| Climate data for Pitztaler Gletscher: 2864m (1991−2020) | |||||||||||||
|---|---|---|---|---|---|---|---|---|---|---|---|---|---|
| Month | Jan | Feb | Mar | Apr | May | Jun | Jul | Aug | Sep | Oct | Nov | Dec | Year |
| Record high °C (°F) | 6.0 (42.8) |
8.0 (46.4) |
7.6 (45.7) |
9.0 (48.2) |
12.7 (54.9) |
17.8 (64.0) |
17.5 (63.5) |
17.6 (63.7) |
16.0 (60.8) |
12.7 (54.9) |
10.2 (50.4) |
6.2 (43.2) |
17.8 (64.0) |
| Mean daily maximum °C (°F) | −4.8 (23.4) |
−5.9 (21.4) |
−3.6 (25.5) |
−1.0 (30.2) |
3.0 (37.4) |
6.3 (43.3) |
8.2 (46.8) |
8.7 (47.7) |
5.2 (41.4) |
2.9 (37.2) |
−1.6 (29.1) |
−4.3 (24.3) |
1.1 (34.0) |
| Daily mean °C (°F) | −8.7 (16.3) |
−9.3 (15.3) |
−7.2 (19.0) |
−4.4 (24.1) |
0.0 (32.0) |
3.8 (38.8) |
6.0 (42.8) |
6.2 (43.2) |
2.6 (36.7) |
0.1 (32.2) |
−4.8 (23.4) |
−7.8 (18.0) |
−2.0 (28.5) |
| Mean daily minimum °C (°F) | −11.2 (11.8) |
−13.2 (8.2) |
−10.4 (13.3) |
−7.9 (17.8) |
−3.3 (26.1) |
0.5 (32.9) |
2.4 (36.3) |
2.8 (37.0) |
−0.4 (31.3) |
−2.8 (27.0) |
−7.8 (18.0) |
−10.7 (12.7) |
−5.2 (22.7) |
| Record low °C (°F) | −27.0 (−16.6) |
−29.0 (−20.2) |
−26.3 (−15.3) |
−23.4 (−10.1) |
−17.5 (0.5) |
−11.2 (11.8) |
−7.0 (19.4) |
−10.2 (13.6) |
−11.4 (11.5) |
−19.4 (−2.9) |
−23.0 (−9.4) |
−26.3 (−15.3) |
−29.0 (−20.2) |
| Source: Central Institute for Meteorology and Geodynamics2 | |||||||||||||
| Climate data for St.Leonhard Pitztal: 1454m (1991−2020) | |||||||||||||
|---|---|---|---|---|---|---|---|---|---|---|---|---|---|
| Month | Jan | Feb | Mar | Apr | May | Jun | Jul | Aug | Sep | Oct | Nov | Dec | Year |
| Record high °C (°F) | 11.7 (53.1) |
13.4 (56.1) |
18.8 (65.8) |
21.6 (70.9) |
25.8 (78.4) |
31.2 (88.2) |
30.3 (86.5) |
29.3 (84.7) |
24.8 (76.6) |
22.3 (72.1) |
19.2 (66.6) |
12.3 (54.1) |
31.2 (88.2) |
| Mean daily maximum °C (°F) | 0.9 (33.6) |
2.7 (36.9) |
6.0 (42.8) |
10.1 (50.2) |
14.3 (57.7) |
18.2 (64.8) |
19.3 (66.7) |
18.8 (65.8) |
15.3 (59.5) |
11.1 (52.0) |
5.5 (41.9) |
1.3 (34.3) |
10.3 (50.5) |
| Daily mean °C (°F) | −4.7 (23.5) |
−3.7 (25.3) |
0.2 (32.4) |
4.0 (39.2) |
8.6 (47.5) |
12.0 (53.6) |
13.8 (56.8) |
13.4 (56.1) |
9.5 (49.1) |
5.5 (41.9) |
0.3 (32.5) |
−3.8 (25.2) |
4.6 (40.3) |
| Mean daily minimum °C (°F) | −9.5 (14.9) |
−10.2 (13.6) |
−5.4 (22.3) |
−1.8 (28.8) |
2.4 (36.3) |
5.8 (42.4) |
7.4 (45.3) |
7.3 (45.1) |
4.0 (39.2) |
0.1 (32.2) |
−4.5 (23.9) |
−8.0 (17.6) |
−1.0 (30.1) |
| Record low °C (°F) | −23.6 (−10.5) |
−28.4 (−19.1) |
−25.2 (−13.4) |
−15.9 (3.4) |
−6.8 (19.8) |
−2.7 (27.1) |
−0.5 (31.1) |
−1.0 (30.2) |
−5.3 (22.5) |
−14.2 (6.4) |
−18.4 (−1.1) |
−22.3 (−8.1) |
−28.4 (−19.1) |
| Source: Central Institute for Meteorology and Geodynamics2 | |||||||||||||
References
References
- "Pitztal". Encyclopedia of Austria. Retrieved 1 November 2013.
- "Klimamittelwerte 1991-2020" (in German). Central Institute for Meteorology and Geodynamics. Retrieved 21 August 2023.