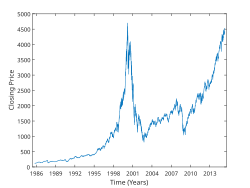
 Nasdaq-100 Index from 1985 to 2015 | |
| Foundation | January 31, 1985 (1985-01-31) |
|---|---|
| Operator | Nasdaq, Inc. |
| Exchanges | Nasdaq |
| Trading symbol | ^NDX or NDX |
| Constituents | 103 |
| Type | Large-cap |
| Market cap | US$31 trillion1 |
| Weighting method | Free-float capitalization-weighted |
| Related indices | Nasdaq Financial-100 |
| Website | www |
- Technology (68.5%)
- Consumer Discretionary (16.5%)
- Telecommunications (3.46%)
- Health Care (3.56%)
- Industrials (3.13%)
- Consumer Staples (2.04%)
- Utilities (1.14%)
- Basic Materials (1.28%)
- Energy (0.45%)
The Nasdaq-100 is a stock market index made up of equity securities issued by approximately 100 (currently 102) of the largest non-financial companies listed on the Nasdaq stock exchange. The Nasdaq-100 is often abbreviated as NDX,3 NDQ, NAS100, or US100. There is approximately $1.4 trillion in assets tracking the index, including exchange-traded funds, mutual funds, and derivatives.1
The Nasdaq-100 index is a public float weighted/capitalization-weighted index. The stocks' weights in the index are based on their market capitalizations, with certain rules capping the influence of the largest components. The index is limited to companies from a single exchange, and it does not have any financial companies. The financial companies are in a separate index, the Nasdaq Financial-100.
Investing in the Nasdaq-100
Index funds, including mutual funds and exchange-traded funds (ETFs), can replicate, before fees and expenses, the performance of the index by holding the same stocks as the index in the same proportions or by holding derivatives that produce the same return as the index. In addition to being traded on U.S. exchanges, index funds that attempt to replicate the performance of the index are available in Canada, the UK, Continental Europe, and elsewhere. The U.S.-traded Invesco QQQ has the highest average daily volume of all Nasdaq-100 ETFs. Modified investment funds based on the index, such as those that use covered options or margin are also available.
Derivatives
The Chicago Mercantile Exchange (CME), via its Globex Trading System, offers Nasdaq-100 futures contracts. Cboe Global Markets offers options on the Nasdaq-100 as well as on ETFs that track the index.
History
The Nasdaq-100 was launched on January 31, 1985, by the Nasdaq.4 It created two indices: the Nasdaq-100, which consists of industrial, technology, retail, telecommunication, biotechnology, health care, transportation, mass media and service companies, and the Nasdaq Financial-100, which consists of banks, Insurance companies, brokerage firms, and mortgage loan companies.
The base price of the index was initially set at 250. In January 1994, in advance of the launch of options trading on the index by the Chicago Board Options Exchange, the value of the index halved, similar to a 2-for-1 stock split, to make the index value below that of the Nasdaq Composite.5
In November 1998, to make the index suitable for the basis of an exchange-traded fund, the index weights were modified away from market cap weights.5
Foreign companies were first admitted to the Nasdaq-100 in January 1998.6
Selection criteria
Entry to the index is determined by the Nasdaq Index Management Committee, which follows a strict, transparent, and rules-based methodology rather than a subjective selection process. Requirements to be added to the index include having a primary listing on the Nasdaq and an average daily traded value of at least $5 million. The index components are recalculated annually after the close of trading on the third Friday in December. The number of shares outstanding and public float of each component is updated quarterly. 7
Performance
Record values
| Category | All-Time Highs8 | |
|---|---|---|
| Closing | 30,660.60 | Tuesday, June 2, 2026 |
| Intraday | 30,762.20 | Wednesday, June 3, 2026 |
Annual returns
Annual returns of the Nasdaq-100 since inception in 1985 are as follows:9
| Year | Closing level | Change in Index in Points |
Change in Index in % |
|---|---|---|---|
| 1985 | 132.29 | ||
| 1986 | 141.41 | 9.12 | 6.89 |
| 1987 | 156.25 | 14.84 | 10.49 |
| 1988 | 177.41 | 21.16 | 13.54 |
| 1989 | 223.84 | 46.43 | 26.17 |
| 1990 | 200.53 | −23.31 | −10.41 |
| 1991 | 330.86 | 130.33 | 64.99 |
| 1992 | 360.19 | 29.33 | 8.86 |
| 1993 | 398.28 | 38.09 | 10.57 |
| 1994 | 404.27 | 5.99 | 1.50 |
| 1995 | 576.23 | 171.96 | 42.54 |
| 1996 | 821.36 | 245.13 | 42.54 |
| 1997 | 990.80 | 169.44 | 20.63 |
| 1998 | 1,836.01 | 845.21 | 85.31 |
| 1999 | 3,707.83 | 1,871.81 | 101.95 |
| 2000 | 2,341.70 | −1,366.13 | −36.84 |
| 2001 | 1,577.05 | −764.65 | −32.65 |
| 2002 | 984.36 | −592.69 | −37.58 |
| 2003 | 1,467.92 | 483.56 | 49.12 |
| 2004 | 1,621.12 | 153.20 | 10.44 |
| 2005 | 1,645.20 | 24.08 | 1.49 |
| 2006 | 1,756.90 | 111.70 | 6.79 |
| 2007 | 2,084.93 | 328.03 | 18.67 |
| 2008 | 1,211.65 | −873.28 | −41.89 |
| 2009 | 1,860.31 | 648.66 | 53.54 |
| 2010 | 2,217.86 | 357.55 | 19.22 |
| 2011 | 2,277.83 | 59.97 | 2.70 |
| 2012 | 2,660.93 | 383.10 | 16.82 |
| 2013 | 3,592.00 | 931.07 | 34.99 |
| 2014 | 4,236.28 | 644.28 | 17.94 |
| 2015 | 4,593.27 | 356.99 | 8.43 |
| 2016 | 4,863.62 | 270.35 | 5.89 |
| 2017 | 6,396.42 | 1,532.80 | 31.52 |
| 2018 | 6,329.96 | −66.46 | −1.04 |
| 2019 | 8,733.07 | 2,403.11 | 37.96 |
| 2020 | 12,888.28 | 4,155.21 | 47.58 |
| 2021 | 16,320.08 | 3,431.80 | 26.63 |
| 2022 | 10,939.76 | −5,380.32 | −32.97 |
| 2023 | 16,825.93 | 5,886.17 | 53.81 |
| 2024 | 21,012.17 | 4,186.24 | 24.88 |
| 2025 | 25,249.85 | 4,237.68 | 20.17 |
Closing milestones
List of 1,000-point milestones by number of trading days
| Milestone (closing)8 | Date of Record (closing)8 | Trading Days8 |
|---|---|---|
| 1,000 | July 8, 1997 | 3,143 |
| 2,000 | January 11, 1999 | 381 |
| 3,000 | November 18, 1999 | 217 |
| 4,000 | February 8, 2000 | 55 |
| 5,000 | January 6, 2017 | 4,255 |
| 6,000 | September 13, 2017 | 172 |
| 7,000 | January 26, 2018 | 93 |
| 8,000 | July 24, 2019 | 374 |
| 9,000 | January 13, 2020 | 119 |
| 10,000 | June 10, 2020 | 103 |
| 11,000 | August 3, 2020 | 37 |
| 12,000 | August 31, 2020 | 20 |
| 13,000 | January 8, 2021 | 90 |
| 14,000 | April 15, 2021 | 66 |
| 15,000 | July 23, 2021 | 69 |
| 16,000 | November 3, 2021 | 72 |
| 17,000 | January 19, 2024 | 554 |
| 18,000 | February 22, 2024 | 23 |
| 19,000 | June 5, 2024 | 72 |
| 20,000 | July 2, 2024 | 18 |
| 21,000 | November 7, 2024 | 90 |
| 22,000 | December 16, 2024 | 26 |
| 23,000 | July 17, 2025 | 144 |
| 24,000 | September 12, 2025 | 40 |
| 25,000 | October 8, 2025 | 18 |
| 26,000 | October 28, 2025 | 14 |
| 27,000 | April 24, 2026 | 122 |
| 28,000 | May 5, 2026 | 7 |
| 29,000 | May 8, 2026 | 3 |
| 30,000 | May 26, 2026 | 11 |
List of 10,000-point milestones by number of trading days
| Milestone (closing)8 | Date of Record (closing)8 | Trading Days8 |
|---|---|---|
| 10,000 | June 10, 2020 | 8,912 |
| 20,000 | July 2, 2024 | 1,021 |
| 30,000 | May 26, 2026 | 475 |
Related indices
Related indices are:
- Nasdaq Composite - includes every company with a primary listing on the Nasdaq
- Nasdaq Financial-100 (IXF) - includes the largest financial companies listed on the Nasdaq
- NASDAQ Q-50 (NXTQ) - includes the 50 stocks that are next eligible for inclusion in the Nasdaq-100
- NASDAQ-100 Technology Sector (NDXT) - an equal weighted index of components of the Nasdaq-100 that have an industry classification of "Technology" per the Industry Classification Benchmark
References
References
- "Assets and Liquidity in the Nasdaq-100 Ecosystem". Nasdaq. May 14, 2026.
- "About QQQ". Invesco.
- "NASDAQ-100 (NDX)". Nasdaq.
- "10 Fun Facts about the Nasdaq-100 Index". Nasdaq.
- "The Nasdaq-100" (PDF). Nasdaq. April 28, 2021.
- "NASDAQ 100". CPRAM.
- "NASDAQ 100 Index Methodology" (PDF). Nasdaq.
- "NASDAQ-100 (^NDX)". Yahoo Finance.
- "NASDAQ 100 (^NDX) historical data". Yahoo! Finance.