Monte Rio | |
|---|---|
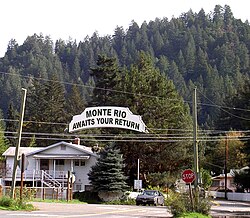 Leaving Monte Rio eastbound on "D" Street | |
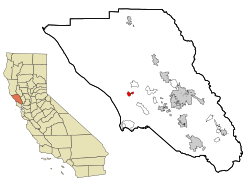 Location in Sonoma County and the state of California | |
| Coordinates: 38°28′13″N 123°0′50″W / 38.47028°N 123.01389°W / 38.47028; -123.013891 | |
| Country |  United States United States |
| State |  California California |
| County | Sonoma |
| Area | |
• Total | 1.986 sq mi (5.143 km2) |
| • Land | 1.905 sq mi (4.935 km2) |
| • Water | 0.080 sq mi (0.208 km2) 4.05% |
| Elevation | 43 ft (13 m) |
| Population (2020)4 | |
• Total | 1,080 |
| • Density | 567/sq mi (219/km2) |
| Time zone | UTC-8 (PST) |
| • Summer (DST) | UTC-7 (PDT) |
| ZIP code | 95462 |
| Area code | 707 |
| FIPS code | 06-48928 |
| GNIS feature ID | 1656174 |
Monte Rio (Spanish: Monte Río, meaning "River Mountain") is a census-designated place (CDP) in Sonoma County, California, United States, along the Russian River, near the Pacific Ocean. The town of Guerneville lies northeast of Monte Rio, and Jenner is to the west. The population was 1,080 at the 2020 census,4 down from 1,152 at the 2010 census. The Bohemian Grove private men's club's campground is located in Monte Rio.
History
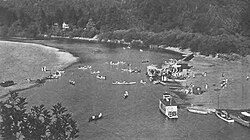
Starting in the 1870s, Monte Rio was a stop on the North Pacific Coast Railroad connecting Cazadero to the Sausalito, California, ferry. Redwood lumber from local sawmills was shipped to build San Francisco. After the sawmills left, the area became known as Vacation Wonderland with trains transporting San Franciscans to summer cabins and even a seven-story hotel downtown. Portions of the 1942 Academy Award-winning film Holiday Inn were filmed at the Village Inn Resort in Monte Rio. The trains no longer run, and the area now is mainly inhabited by year-round residents.
Despite heavy logging during the second half of the 19th century, the Sonoma Lumber Company preserved a 160-acre (65 ha) grove of old-growth redwood trees, which was sold to San Francisco's Bohemian Club in 1899. The club purchased dozens of other parcels in the area, and now owns 2,712 acres (1,098 ha), which are used for its summer retreats.5
Geography
According to the United States Census Bureau, the CDP has a total area of 2.0 square miles (5.2 km2), of which 1.9 square miles (4.9 km2) is land and 0.08 square miles (0.21 km2), or 4.05%, is water.2
Demographics
| Census | Pop. | Note | %± |
|---|---|---|---|
| 1980 | 1,137 | — | |
| 1990 | 1,058 | −6.9% | |
| 2000 | 1,104 | 4.3% | |
| 2010 | 1,152 | 4.3% | |
| 2020 | 1,080 | −6.2% | |
| 2022 (est.) | 771 | 6  | −28.6% |
| U.S Census 1880-19807 U.S. Decennial Census8 1860–1870910 1880-189011 190012 191013 192014 193015 194016 195017 19601819 197020 198021 199022 200023 201024 2020 | |||
Racial and ethnic composition
| Race / Ethnicity (NH = Non-Hispanic) | Pop 200025 | Pop 201026 | Pop 202027 | % 2000 | % 2010 | % 2020 |
|---|---|---|---|---|---|---|
| White alone (NH) | 969 | 997 | 872 | 87.77% | 86.55% | 80.74% |
| Black or African American alone (NH) | 6 | 9 | 9 | 0.54% | 0.78% | 0.83% |
| Native American or Alaska Native alone (NH) | 2 | 5 | 11 | 0.18% | 0.43% | 1.02% |
| Asian alone (NH) | 8 | 11 | 19 | 0.72% | 0.95% | 1.76% |
| Native Hawaiian or Pacific Islander alone (NH) | 1 | 1 | 3 | 0.09% | 0.09% | 0.28% |
| Other race alone (NH) | 0 | 1 | 18 | 0.00% | 0.09% | 1.67% |
| Mixed race or Multiracial (NH) | 37 | 49 | 72 | 3.35% | 4.25% | 6.67% |
| Hispanic or Latino (any race) | 81 | 79 | 76 | 7.34% | 6.86% | 7.04% |
| Total | 1,104 | 1,152 | 1,080 | 100.00% | 100.00% | 100.00% |
2020 census
As of the 2020 census, Monte Rio had a population of 1,080 and a population density of 566.9 inhabitants per square mile (218.9/km2).2829 0.0% of residents lived in urban areas, while 100.0% lived in rural areas.30
The age distribution was 112 people (10.4%) under the age of 18, 45 people (4.2%) aged 18 to 24, 219 people (20.3%) aged 25 to 44, 409 people (37.9%) aged 45 to 64, and 295 people (27.3%) who were 65 years of age or older. The median age was 55.3 years. For every 100 females, there were 116.0 males, and for every 100 females age 18 and over there were 119.0 males age 18 and over.28
The census reported that 1,049 people (97.1% of the population) lived in households, 31 (2.9%) lived in non-institutionalized group quarters, and no one was institutionalized.28 There were 526 households, out of which 47 (8.9%) had children under the age of 18 living in them. Of all households, 177 (33.7%) were married-couple households, 52 (9.9%) were cohabiting couple households, 163 (31.0%) were households with a male householder and no spouse or partner present, and 134 (25.5%) were households with a female householder and no spouse or partner present. About 223 households (42.4%) were made up of individuals, and 104 (19.8%) had someone living alone who was 65 years of age or older.28
There were 811 housing units at an average density of 425.7 units per square mile (164.4 units/km2), of which 526 (64.9%) were occupied and 285 (35.1%) were vacant. The homeowner vacancy rate was 1.1% and the rental vacancy rate was 6.6%. Of occupied units, 342 (65.0%) were owner-occupied and 184 (35.0%) were occupied by renters.28 The average household size was 1.99. There were 242 families (46.0% of all households).31
| Race | Number | Percent |
|---|---|---|
| White | 894 | 82.8% |
| Black or African American | 9 | 0.8% |
| American Indian and Alaska Native | 11 | 1.0% |
| Asian | 19 | 1.8% |
| Native Hawaiian and Other Pacific Islander | 3 | 0.3% |
| Some other race | 42 | 3.9% |
| Two or more races | 102 | 9.4% |
2010 census
The 2010 United States census32 reported that Monte Rio had a population of 1,152. The population density was 582.9 inhabitants per square mile (225.1/km2). The racial makeup of Monte Rio was 1,047 (90.9%) White, 10 (0.9%) African American, 6 (0.5%) Native American, 11 (1.0%) Asian, 1 (0.1%) Pacific Islander, 16 (1.4%) from other races, and 61 (5.3%) from two or more races. Hispanic or Latino of any race were 79 persons (6.9%).
The Census reported that 93.6% of the population lived in households and 6.4% lived in non-institutionalized group quarters.
There were 576 households, out of which 85 (14.8%) had children under the age of 18 living in them, 151 (26.2%) were opposite-sex married couples living together, 43 (7.5%) had a female householder with no husband present, 32 (5.6%) had a male householder with no wife present. There were 42 (7.3%) unmarried opposite-sex partnerships, and 37 (6.4%) same-sex married couples or partnerships. 247 households (42.9%) were made up of individuals, and 61 (10.6%) had someone living alone who was 65 years of age or older. The average household size was 1.87. There were 226 families (39.2% of all households); the average family size was 2.54.
The population was spread out, with 132 people (11.5%) under the age of 18, 63 people (5.5%) aged 18 to 24, 253 people (22.0%) aged 25 to 44, 528 people (45.8%) aged 45 to 64, and 176 people (15.3%) who were 65 years of age or older. The median age was 50.7 years. For every 100 females, there were 119.8 males. For every 100 females age 18 and over, there were 125.2 males.
There were 930 housing units at an average density of 470.5 per square mile (181.7/km2), of which 56.9% were owner-occupied and 43.1% were occupied by renters. The homeowner vacancy rate was 3.7%; the rental vacancy rate was 9.1%. 57.0% of the population lived in owner-occupied housing units and 36.5% lived in rental housing units.
2000 census
As of the census33 of 2000, the median income for a household in the CDP was $38,299, and the median income for a family was $46,336. Males had a median income of $29,135 versus $28,750 for females. The per capita income for the CDP was $20,262. About 12.1% of families and 16.0% of the population were below the poverty line, including 22.7% of those under age 18 and none of those age 65 or over.
Government
In the California State Legislature, Monte Rio is in the 2nd senatorial district, represented by Democrat Mike McGuire, and in the 2nd Assembly district, represented by Democrat Chris Rogers.34
In the United States House of Representatives, Monte Rio is in California's 2nd congressional district, represented by Democrat Jared Huffman.35
Education
The school districts are Monte Rio Union Elementary School District and West Sonoma County Union High School District.36
References
References
- "US Gazetteer files: 2010, 2000, and 1990". United States Census Bureau. February 12, 2011. Retrieved April 23, 2011.
- "2020 U.S. Gazetteer Files". United States Census Bureau. Retrieved June 27, 2025.
- "Monte Rio". Geographic Names Information System. United States Geological Survey, United States Department of the Interior. Retrieved April 17, 2015.
- "Monte Rio CDP, California - Census Bureau Profile". data.census.gov. United States Census Bureau. Retrieved June 27, 2025.
- Phillips, Peter Martin (1994). A Relative Advantage: Sociology of the San Francisco Bohemian Club (Ph.D.). Sonoma State University. p. 22. hdl:10211.3/143729. Archived from the original on July 22, 2012.
- "ACS Survey Population Estimate 2022".
- "Population Totals by Township and Place for California Counties: 1860 to 1950". dof.ca.gov.
- "Decennial Census by Decade". United States Census Bureau.
- "1870 Census of Population - Population of Civil Divisions less than Counties - California - Almeda County to Sutter County" (PDF). United States Census Bureau. Archived from the original (PDF) on January 26, 2025 – via Wayback Machine.
- "1870 Census of Population - Population of Civil Divisions less than Counties - California - Tehama County to Yuba County" (PDF). United States Census Bureau. Archived from the original (PDF) on February 2, 2025 – via Wayback Machine.
- "1890 Census of Population - Population of California by Minor Civil Divisions" (PDF). United States Census Bureau. Archived from the original (PDF) on March 11, 2025 – via Wayback Machine.
- "1900 Census of Population - Population of California by Counties and Minor Civil Divisions" (PDF). United States Census Bureau. Archived from the original (PDF) on March 4, 2025 – via Wayback Machine.
- "1910 Census of Population - Supplement for California" (PDF). United States Census Bureau. Archived from the original (PDF) on April 4, 2025. Retrieved February 4, 2025 – via Wayback Machine.
- "1920 Census of Population - Number of Inhabitants - California" (PDF). United States Census Bureau. Archived from the original (PDF) on April 28, 2025 – via Wayback Machine.
- "1930 Census of Population - Number and Distribution of Inhabitants - California" (PDF). United States Census Bureau. Archived from the original (PDF) on March 17, 2025 – via Wayback Machine.
- "1940 Census of Population - Number of Inhabitants - California" (PDF). United States Census Bureau. Archived from the original (PDF) on January 26, 2025 – via Wayback Machine.
- "1950 Census of Population - Number of Inhabitants - California" (PDF). United States Census Bureau. Archived from the original (PDF) on February 19, 2025 – via Wayback Machine.
- "1960 Census of Population - Number of Inhabitants - California" (PDF). United States Census Bureau. Archived from the original (PDF) on March 22, 2025 – via Wayback Machine.
- "1960 Census of Population - General population Characteristics - California" (PDF). United States Census Bureau. Archived from the original (PDF) on March 22, 2025 – via Wayback Machine.
- "1970 Census of Population - Number of Inhabitants - California" (PDF). United States Census Bureau. Archived from the original (PDF) on February 26, 2025 – via Wayback Machine.
- "1980 Census of Population - Number of Inhabitants - California" (PDF). United States Census Bureau. Archived from the original (PDF) on January 26, 2025 – via Wayback Machine.
- "1990 Census of Population - Population and Housing Unit Counts - California" (PDF). United States Census Bureau. Archived from the original (PDF) on January 26, 2025 – via Wayback Machine.
- "2000 Census of Population - Population and Housing Unit Counts - California" (PDF). United States Census Bureau. Archived from the original (PDF) on March 22, 2025 – via Wayback Machine.
- "2010 Census of Population - Population and Housing Unit Counts - California" (PDF). United States Census Bureau. Archived from the original (PDF) on March 28, 2025 – via Wayback Machine.
- "P004: Hispanic or Latino, and Not Hispanic or Latino by Race – 2000: DEC Summary File 1 – Monte Rio CDP, California". United States Census Bureau.
- "P2: Hispanic or Latino, and Not Hispanic or Latino by Race – 2010: DEC Redistricting Data (PL 94-171) – Monte Rio CDP, California". United States Census Bureau.
- "P2: Hispanic or Latino, and Not Hispanic or Latino by Race – 2020: DEC Redistricting Data (PL 94-171) – Monte Rio CDP, California". United States Census Bureau.
- "2020 Decennial Census Demographic Profile (DP1)". United States Census Bureau. 2021. Retrieved April 30, 2026.
- "2020 Decennial Census Redistricting Data (Public Law 94-171)". United States Census Bureau. 2021. Retrieved April 30, 2026.
- "2020 Decennial Census Demographic and Housing Characteristics (DHC)". United States Census Bureau. 2023. Retrieved April 30, 2026.
- "Monte Rio CDP, California; P16: Household Type - 2020 Census of Population and Housing". US Census Bureau. Retrieved May 29, 2025.
- "2010 Census Interactive Population Search: CA - Monte Rio CDP". U.S. Census Bureau. Retrieved July 12, 2014.
{{cite web}}: CS1 maint: deprecated archival service (link) - "U.S. Census website". United States Census Bureau. Retrieved January 31, 2008.
- "Statewide Database". UC Regents. Archived from the original on February 1, 2015. Retrieved December 5, 2014.
- "California's 2nd Congressional District - Representatives & District Map". Civic Impulse, LLC. Retrieved March 8, 2013.
- "2020 CENSUS - SCHOOL DISTRICT REFERENCE MAP: Sonoma County, CA" (PDF). U.S. Census Bureau. Retrieved December 7, 2024. - Text list