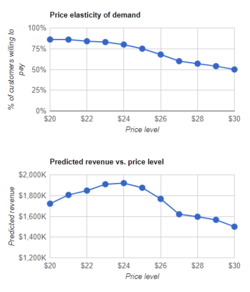
The Gabor–Granger method is a method to determine the price for a new product or service. It was developed in the 1960s by Clive Granger and André Gabor. It is a variant of monadic price testing.
To use the Gabor-Granger method in a survey, one must find the highest price that respondents are willing to pay. There are many ways to do this but the most common is done by choosing 5 price points for the survey and then asking the respondent a 5-point purchase intent question for a random price from those 5 established price points. If the respondent answers in the top 2 choices - 'Definitely Buy' or 'Probably Buy' for this question, they are then asked the same question for a random price that is higher than was just asked. If it is not in the top 2 then the respondent is asked the same question for a random lower price. This is done until you find the highest price the respondent is in top 2 on Purchase Intent Scale. If they are not in top 2 for the lowest of the 5 prices, the respondent is usually coded as a zero or deleted from the analysis.
For example, say the 5 prices chosen are $1, $2, $3, $4 and $5. A first random chosen price might be $4. If the respondent is in top 2 on purchase intent, they would then be asked if their intent to purchase at $5, the next highest price. If they are in top 2 on $5 they are coded as $5 since they signal high intent to pay the maximum price. If they are not in top 2 on $5, they are coded as $4 as this was the highest price they signaled a high intent to pay.
If the respondent is not top 2 intent categories for $4, then they are asked a random lower price. This procedure continues until you have found the highest price the respondent is willing to pay among the price points. This is your Gabor-Granger variable.
Once you have this Gabor-Granger variable, the results can be used to produce a demand chart (where x-axis are the prices and y axis the percentage of people willing to pay that price) and a revenue curve (where y-axis is the predicted revenue and x-axis is still price).1