 Alberta electoral district Alberta electoral district | |||
|---|---|---|---|
  Interactive map of riding boundaries from the 2025 federal election | |||
| Federal electoral district | |||
| Legislature | House of Commons | ||
| MP |
Conservative | ||
| District created | 2013 | ||
| First contested | 2015 | ||
| Last contested | 2025 | ||
| District webpage | profile, map | ||
| Demographics | |||
| Population (2016)1 | 121,048 | ||
| Electors (2019) | 89,075 | ||
| Area (km²)2 | 158 | ||
| Pop. density (per km²) | 766.1 | ||
| Census division | Division No. 11 | ||
| Census subdivision | Edmonton (part) | ||
Edmonton Manning is a federal electoral district in Alberta, Canada, that has been represented in the House of Commons of Canada since 2015.
Edmonton Manning was created by the 2012 federal electoral boundaries redistribution and was legally defined in the 2013 representation order. It came into effect upon the call of the 42nd Canadian federal election, which took place on October 19, 2015.3 It was created out of parts of the electoral districts of Edmonton—Sherwood Park, Edmonton East and Edmonton—St. Albert.4
Geography
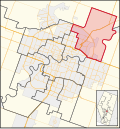
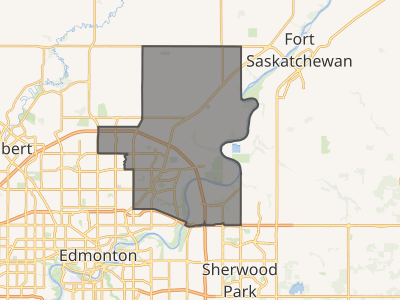
Edmonton Manning is located in the northeast corner of Edmonton.
Demographics
- According to the 2011 Canadian census5
Languages: 67.1% English, 6.1% Chinese, 2.3% Arabic, 2.3% Punjabi, 2.2% Spanish, 1.9% French, 1.9% Vietnamese, 1.7% Ukrainian, 1.6% Tagalog, 1.5% Polish, 1.2% Portuguese, 1.1% Hindi, 1.1% Italian, 8.0% Other
Religions: 57.3% Christian, 7.5% Muslim, 3.2% Buddhist, 2.5% Sikh, 1.3% Hindu, 0.3% Other, 27.9% None
Median income: $35,715 (2010)
Average income: $42,332 (2010)
| Panethnic group |
20216 | 20167 | 20118 | |||||||||||
|---|---|---|---|---|---|---|---|---|---|---|---|---|---|---|
| Pop. | % | Pop. | % | Pop. | % | |||||||||
| Europeana | 61,360 | 46.9% | 64,035 | 53.39% | 63,520 | 60.29% | ||||||||
| African | 17,460 | 13.34% | 11,130 | 9.28% | 6,010 | 5.7% | ||||||||
| Southeast Asianb | 10,975 | 8.39% | 8,415 | 7.02% | 6,770 | 6.43% | ||||||||
| South Asian | 9,785 | 7.48% | 8,415 | 7.02% | 6,675 | 6.34% | ||||||||
| Middle Easternc | 8,580 | 6.56% | 6,565 | 5.47% | 4,040 | 3.83% | ||||||||
| Indigenous | 7,950 | 6.08% | 7,495 | 6.25% | 6,125 | 5.81% | ||||||||
| East Asiand | 7,805 | 5.97% | 8,260 | 6.89% | 8,015 | 7.61% | ||||||||
| Latin American | 3,545 | 2.71% | 3,315 | 2.76% | 2,725 | 2.59% | ||||||||
| Other/Multiraciale | 3,375 | 2.58% | 2,315 | 1.93% | 1,470 | 1.4% | ||||||||
| Total responses | 130,840 | 98.95% | 119,940 | 99.08% | 105,355 | 99.2% | ||||||||
| Total population | 132,224 | 100% | 121,048 | 100% | 106,208 | 100% | ||||||||
| Notes: Totals greater than 100% due to multiple origin responses. Demographics based on 2012 Canadian federal electoral redistribution riding boundaries. | ||||||||||||||
Members of Parliament
This riding has elected the following members of the House of Commons of Canada:
| Parliament | Years | Member | Party | |
|---|---|---|---|---|
| Edmonton Manning Riding created from Edmonton East, Edmonton—Sherwood Park and Edmonton—St. Albert |
||||
| 42nd | 2015–2019 | Ziad Aboultaif | Conservative | |
| 43rd | 2019–2021 | |||
| 44th | 2021–2025 | |||
| 45th | 2025–present | |||
Election results
2023 representation order
| 2025 Canadian federal election | ||||||||
|---|---|---|---|---|---|---|---|---|
| Party | Candidate | Votes | % | ±% | Expenditures | |||
| Conservative | Ziad Aboultaif | 26,445 | 53.09 | +11.97 | $73,826.17 | |||
| Liberal | Blair-Marie Coles | 17,603 | 35.34 | +14.77 | $13,445.58 | |||
| New Democratic | Lesley Thompson | 4,935 | 9.91 | –21.10 | $18,380.84 | |||
| People's | Robert Bard | 824 | 1.65 | –5.36 | $1,775.85 | |||
| Total valid votes/expense limit | 49,807 | 99.00 | – | $128,415.60 | ||||
| Total rejected ballots | 505 | 1.00 | +0.14 | |||||
| Turnout | 50,312 | 61.18 | +6.11 | |||||
| Eligible voters | 82,238 | |||||||
| Conservative notional hold | Swing | –1.40 | ||||||
| Source: Elections Canada910 | ||||||||
| 2021 federal election redistributed results11 | |||
|---|---|---|---|
| Party | Vote | % | |
| Conservative | 16,903 | 41.12 | |
| New Democratic | 12,749 | 31.01 | |
| Liberal | 8,456 | 20.57 | |
| People's | 2,883 | 7.01 | |
| Others | 115 | 0.28 | |
2013 representation order
| 2021 Canadian federal election | ||||||||
|---|---|---|---|---|---|---|---|---|
| Party | Candidate | Votes | % | ±% | Expenditures | |||
| Conservative | Ziad Aboultaif | 20,219 | 41.07 | –14.88 | $36,173.22 | |||
| New Democratic | Charmaine St. Germain | 14,999 | 30.47 | +12.90 | $5,643.23 | |||
| Liberal | Donna Lynn Smith | 10,468 | 21.27 | –0.23 | $14,542.92 | |||
| People's | Martin Halvorson | 3,407 | 6.92 | +4.88 | $3,852.57 | |||
| Marxist–Leninist | André Vachon | 133 | 0.27 | +0.14 | none listed | |||
| Total valid votes/expense limit | 49,226 | 99.14 | – | $118,181.44 | ||||
| Total rejected ballots | 429 | 0.86 | +0.21 | |||||
| Turnout | 49,655 | 55.07 | –5.77 | |||||
| Eligible voters | 90,163 | |||||||
| Conservative hold | Swing | –13.89 | ||||||
| Source: Elections Canada1213 | ||||||||
| 2019 Canadian federal election | ||||||||
|---|---|---|---|---|---|---|---|---|
| Party | Candidate | Votes | % | ±% | Expenditures | |||
| Conservative | Ziad Aboultaif | 30,425 | 55.95 | +10.71 | $62,911.58 | |||
| Liberal | Kamal Kadri | 11,692 | 21.50 | –6.07 | $27,361.82 | |||
| New Democratic | Charmaine St. Germain | 9,555 | 17.57 | –6.07 | $2,962.31 | |||
| Green | Laura-Leah Shaw | 1,255 | 2.31 | +0.11 | none listed | |||
| People's | Daniel Summers | 1,109 | 2.04 | – | $1,903.10 | |||
| Christian Heritage | Pam Phiri | 276 | 0.51 | – | $751.22 | |||
| Marxist–Leninist | André Vachon | 68 | 0.13 | –0.13 | none listed | |||
| Total valid votes/expense limit | 54,380 | 99.35 | – | $114,605.47 | ||||
| Total rejected ballots | 357 | 0.65 | +0.27 | |||||
| Turnout | 54,737 | 60.84 | +0.39 | |||||
| Eligible voters | 89,968 | |||||||
| Conservative hold | Swing | +8.37 | ||||||
| Source: Elections Canada1415 | ||||||||
| 2015 Canadian federal election | ||||||||
|---|---|---|---|---|---|---|---|---|
| Party | Candidate | Votes | % | ±% | Expenditures | |||
| Conservative | Ziad Aboultaif | 22,166 | 45.24 | –10.22 | $93,803.50 | |||
| Liberal | Sukhdev Aujla | 13,509 | 27.57 | +18.47 | $29,398.30 | |||
| New Democratic | Aaron Paquette | 11,582 | 23.64 | –2.94 | $81,387.20 | |||
| Green | Chris Vallee | 1,079 | 2.20 | –0.67 | $960.75 | |||
| Independent | Mebreate Deres | 540 | 1.10 | – | none listed | |||
| Marxist–Leninist | André Vachon | 125 | 0.26 | – | none listed | |||
| Total valid votes/expense limit | 49,001 | 99.62 | – | $214,913.28 | ||||
| Total rejected ballots | 185 | 0.38 | – | |||||
| Turnout | 49,186 | 60.45 | – | |||||
| Eligible voters | 81,361 | |||||||
| Conservative hold | Swing | –14.34 | ||||||
| Source: Elections Canada1617 | ||||||||
| 2011 federal election redistributed results18 | |||
|---|---|---|---|
| Party | Vote | % | |
| Conservative | 18,952 | 55.45 | |
| New Democratic | 9,082 | 26.57 | |
| Liberal | 3,111 | 9.10 | |
| Others | 2,050 | 6.00 | |
| Green | 983 | 2.88 | |
See also
See also
Notes
Notes
- Statistic includes all persons that did not make up part of a visible minority or an indigenous identity.
- Statistic includes total responses of "Filipino" and "Southeast Asian" under visible minority section on census.
- Statistic includes total responses of "West Asian" and "Arab" under visible minority section on census.
- Statistic includes total responses of "Chinese", "Korean", and "Japanese" under visible minority section on census.
- Statistic includes total responses of "Visible minority, n.i.e." and "Multiple visible minorities" under visible minority section on census.
References
References
- Statistics Canada: 2011
- Statistics Canada: 2011
- Timeline for the Redistribution of Federal Electoral Districts, archived from the original on April 18, 2017, retrieved July 2, 2013
- Report – Alberta, archived from the original on August 24, 2021, retrieved July 2, 2013
- "Statistics Canada: 2011 National Household Survey Profile". May 8, 2013.
- Government of Canada, Statistics Canada (October 26, 2022). "Census Profile, 2021 Census of Population". www12.statcan.gc.ca. Retrieved April 1, 2023.
- Government of Canada, Statistics Canada (October 27, 2021). "Census Profile, 2016 Census". www12.statcan.gc.ca. Retrieved April 1, 2023.
- Government of Canada, Statistics Canada (November 27, 2015). "NHS Profile". www12.statcan.gc.ca. Retrieved April 1, 2023.
- "Forty-Fifth General Election 2025 — Poll-by-poll Results: Edmonton Manning". elections.ca. Elections Canada. 2025.
- Canada, Chief Electoral Officer (2025). "Candidate Campaign Returns, 2025 General Election: Part 3C – Summary of Electoral Campaign Expenses and Other Outflows – Election expenses subject to the limit – Total". elections.ca. Elections Canada.
Expenses are reported "as amended" where amendments have been filed; otherwise, they are reported "as submitted".
- "Transposition of Votes from the 44th General Election to the 2023 Representation Orders". Elections Canada. Retrieved April 9, 2024.
- "Forty-Fourth General Election 2021 — Poll-by-poll Results: Edmonton Manning". elections.ca. Elections Canada. 2021.
- Canada, Chief Electoral Officer (2021). "Candidate Campaign Returns, 2021 General Election: Part 3C – Summary of Electoral Campaign Expenses and Other Outflows – Election expenses subject to the limit – Total". elections.ca. Elections Canada.
Expenses are reported "as amended" where amendments have been filed; otherwise, they are reported "as submitted".
- "Forty-Third General Election 2019 — Poll-by-poll Results: Edmonton Manning". elections.ca. Elections Canada. 2019.
- Canada, Chief Electoral Officer (2019). "Candidate Campaign Returns, 2019 General Election: Part 3C – Summary of Electoral Campaign Expenses and Other Outflows – Election expenses subject to the limit – Total". elections.ca. Elections Canada.
Expenses are reported "as amended" where amendments have been filed; otherwise, they are reported "as submitted".
- "Forty-Second General Election 2015 — Poll-by-poll Results: Edmonton Manning". elections.ca. Elections Canada. 2015.
- Canada, Chief Electoral Officer (2015). "Candidate Campaign Returns, 2015 General Election: Part 4 – Campaign Financial Summary – Total election expenses subject to the limit". elections.ca. Elections Canada.
Expenses are reported "as amended" where amendments have been filed; otherwise, they are reported "as submitted".
- Pundits' Guide to Canadian Elections