 Alberta electoral district Alberta electoral district | |||
|---|---|---|---|
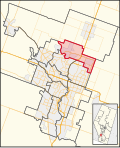 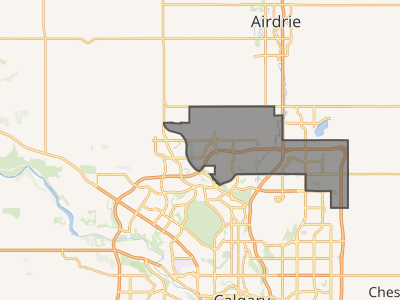 Interactive map of riding boundaries from the 2025 federal election | |||
| Federal electoral district | |||
| Legislature | House of Commons | ||
| MP |
Conservative | ||
| District created | 2013 | ||
| First contested | 2015 | ||
| Last contested | 2025 | ||
| District webpage | profile, map | ||
| Demographics | |||
| Population (2011)1 | 110,189 | ||
| Electors (2019) | 84,116 | ||
| Area (km²)2 | 123 | ||
| Pop. density (per km²) | 895.8 | ||
| Census division | Division No. 6 | ||
| Census subdivision | Calgary (part) | ||
Calgary Skyview is a federal electoral district in Alberta, Canada, that has been represented in the House of Commons of Canada since 2015.
Calgary Skyview was created by the 2012 federal electoral boundaries redistribution and was legally defined in the 2013 representation order. It came into effect upon the call of the 42nd Canadian federal election, scheduled for October 2015.3 It was created out of the electoral district of Calgary Northeast.4
In the 2022 Canadian federal electoral redistribution, southern parts of the riding will break off into the new Calgary McKnight district.5
Geography
The district consists of the Northeasternmost corner of the city of Calgary. It includes the communities surrounding the Calgary International Airport, although the airport itself has been redistributed into the district of Calgary McKnight.
Demographics
- According to the 2011 Canadian census6
Languages: 50.0% English, 16.7% Punjabi, 6.5% Urdu, 4.4% Tagalog, 3.7% Chinese, 2.7% Spanish, 1.7% Arabic, 1.5% Vietnamese, 1.4% Hindi, 1.2% Persian, 1.2% French, 1.0% Bengali, 8.0% Other
Religions: 42.4% Christian, 16.3% Sikh, 14.3% Muslim, 4.5% Hindu, 2.2% Buddhist, 0.5% Other, 19.8% None
Median income: $30,961 (2010)
Average income: $37,064 (2010)
| Panethnic group |
20217 | 20168 | 20119 | |||||||||||
|---|---|---|---|---|---|---|---|---|---|---|---|---|---|---|
| Pop. | % | Pop. | % | Pop. | % | |||||||||
| South Asian | 65,630 | 41.38% | 50,290 | 37.22% | 34,385 | 31.38% | ||||||||
| Europeana | 33,480 | 21.11% | 37,870 | 28.03% | 41,315 | 37.7% | ||||||||
| Southeast Asianb | 21,395 | 13.49% | 16,055 | 11.88% | 11,605 | 10.59% | ||||||||
| African | 13,075 | 8.24% | 9,705 | 7.18% | 5,655 | 5.16% | ||||||||
| Middle Easternc | 7,620 | 4.8% | 6,315 | 4.67% | 4,335 | 3.96% | ||||||||
| East Asiand | 6,085 | 3.84% | 5,665 | 4.19% | 5,020 | 4.58% | ||||||||
| Latin American | 3,945 | 2.49% | 3,365 | 2.49% | 2,770 | 2.53% | ||||||||
| Indigenous | 3,695 | 2.33% | 3,330 | 2.46% | 2,940 | 2.68% | ||||||||
| Other/Multiraciale | 3,685 | 2.32% | 2,515 | 1.86% | 1,545 | 1.41% | ||||||||
| Total responses | 158,605 | 99.35% | 135,110 | 99.54% | 109,575 | 99.44% | ||||||||
| Total population | 159,642 | 100% | 135,730 | 100% | 110,189 | 100% | ||||||||
| Notes: Totals greater than 100% due to multiple origin responses. Demographics based on 2012 Canadian federal electoral redistribution riding boundaries. | ||||||||||||||
Members of Parliament
This riding has elected the following members of the House of Commons of Canada:
| Parliament | Years | Member | Party | |
|---|---|---|---|---|
| Calgary Skyview Riding created from Calgary Northeast |
||||
| 42nd | 2015–2017 | Darshan Kang | Liberal | |
| 2017–2019 | Independent | |||
| 43rd | 2019–2021 | Jag Sahota | Conservative | |
| 44th | 2021–2025 | George Chahal | Liberal | |
| 45th | 2025–present | Amanpreet Gill | Conservative | |
Election results
2023 representation order
| 2025 Canadian federal election | ||||||||
|---|---|---|---|---|---|---|---|---|
| Party | Candidate | Votes | % | ±% | Expenditures | |||
| Conservative | Amanpreet S. Gill | 27,808 | 55.45 | +10.49 | $109,959.91 | |||
| Liberal | Hafeez Malik | 18,842 | 37.57 | +4.45 | $83,972.11 | |||
| New Democratic | Rajesh Angral | 1,351 | 2.69 | –13.84 | ||||
| Independent | Minesh Patel | 1,002 | 2.00 | – | none listed | |||
| Independent | Scott Calverley | 620 | 1.24 | – | none listed | |||
| Independent | Jag Anand | 529 | 1.05 | – | $16,171.04 | |||
| Total valid votes/expense limit | 50,152 | 99.28 | – | $128,083.71 | ||||
| Total rejected ballots | 362 | 0.72 | –0.33 | |||||
| Turnout | 50,514 | 61.52 | +7.02 | |||||
| Eligible voters | 82,111 | |||||||
| Conservative notional hold | Swing | +7.47 | ||||||
| Source: Elections Canada1011 | ||||||||
| 2021 federal election redistributed results12 | |||
|---|---|---|---|
| Party | Vote | % | |
| Conservative | 16,151 | 44.96 | |
| Liberal | 11,899 | 33.12 | |
| New Democratic | 5,938 | 16.53 | |
| People's | 1,344 | 3.74 | |
| Green | 328 | 0.91 | |
| Others | 262 | 0.73 | |
2013 representation order
| 2021 Canadian federal election | ||||||||
|---|---|---|---|---|---|---|---|---|
| Party | Candidate | Votes | % | ±% | Expenditures | |||
| Liberal | George Chahal | 20,092 | 42.36 | +14.02 | $102,944.51 | |||
| Conservative | Jag Sahota | 17,111 | 36.07 | –16.42 | $82,418.22 | |||
| New Democratic | Gurinder Singh Gill | 7,690 | 16.21 | +1.29 | $15,396.31 | |||
| People's | Harry Dhillon | 1,720 | 3.63 | +2.44 | $3,904.85 | |||
| Green | Janna So | 432 | 0.91 | –0.67 | none listed | |||
| Independent | Lee Aquart | 184 | 0.39 | – | $4,123.83 | |||
| Marxist–Leninist | Daniel Blanchard | 111 | 0.23 | –0.03 | none listed | |||
| Centrist | Nadeem Rana | 93 | 0.20 | – | $674.40 | |||
| Total valid votes/expense limit | 47,433 | 98.95 | – | $116,250.12 | ||||
| Total rejected ballots | 502 | 1.05 | +0.08 | |||||
| Turnout | 47,935 | 54.50 | –5.62 | |||||
| Eligible voters | 87,956 | |||||||
| Liberal gain from Conservative | Swing | +15.22 | ||||||
| Source: Elections Canada1314 | ||||||||
| 2019 Canadian federal election | ||||||||
|---|---|---|---|---|---|---|---|---|
| Party | Candidate | Votes | % | ±% | Expenditures | |||
| Conservative | Jag Sahota | 26,533 | 52.49 | +12.74 | $102,742.88 | |||
| Liberal | Nirmala Naidoo | 14,327 | 28.34 | –17.54 | $53,661.28 | |||
| New Democratic | Gurinder Singh Gill | 7,540 | 14.92 | +6.90 | $59,503.13 | |||
| Green | Signe Knutson | 800 | 1.58 | –0.30 | none listed | |||
| People's | Harry Dhillon | 603 | 1.19 | – | $8,416.69 | |||
| Christian Heritage | Joseph Alexander | 483 | 0.96 | – | $8,970.10 | |||
| Canada's Fourth Front | Harpreet Singh Dawar | 136 | 0.27 | – | $7,170.00 | |||
| Marxist–Leninist | Daniel Blanchard | 130 | 0.26 | +0.06 | none listed | |||
| Total valid votes/expense limit | 50,552 | 99.03 | – | $110,470.52 | ||||
| Total rejected ballots | 497 | 0.97 | +0.29 | |||||
| Turnout | 51,049 | 60.12 | –0.61 | |||||
| Eligible voters | 84,915 | |||||||
| Conservative gain from Liberal | Swing | +15.14 | ||||||
| Source: Elections Canada1516 | ||||||||
| 2015 Canadian federal election | ||||||||
|---|---|---|---|---|---|---|---|---|
| Party | Candidate | Votes | % | ±% | Expenditures | |||
| Liberal | Darshan Kang | 20,644 | 45.88 | +17.24 | $125,611.09 | |||
| Conservative | Devinder Shory | 17,885 | 39.75 | –16.50 | $155,284.22 | |||
| New Democratic | Sahajvir Singh | 3,605 | 8.01 | –2.03 | $91,462.67 | |||
| Progressive Canadian | Najeeb Butt | 957 | 2.13 | – | $8,150.00 | |||
| Green | Ed Reddy | 846 | 1.88 | –2.75 | $682.50 | |||
| Democratic Advancement | Stephen J. Garvey | 786 | 1.75 | – | $31,834.16 | |||
| Independent | Joseph Young | 182 | 0.40 | – | $1,614.02 | |||
| Marxist–Leninist | Daniel Blanchard | 88 | 0.20 | –0.24 | none listed | |||
| Total valid votes/expense limit | 44,993 | 99.32 | – | $206,487.35 | ||||
| Total rejected ballots | 310 | 0.68 | – | |||||
| Turnout | 45,303 | 60.72 | – | |||||
| Eligible voters | 74,604 | |||||||
| Liberal gain from Conservative | Swing | +16.87 | ||||||
| Source: Elections Canada1718 | ||||||||
| 2011 federal election redistributed results19 | |||
|---|---|---|---|
| Party | Vote | % | |
| Conservative | 16,573 | 56.25 | |
| Liberal | 8,438 | 28.64 | |
| New Democratic | 2,959 | 10.04 | |
| Green | 1,364 | 4.63 | |
| Marxist–Leninist | 129 | 0.44 | |
See also
See also
Notes
Notes
- Statistic includes all persons that did not make up part of a visible minority or an indigenous identity.
- Statistic includes total responses of "Filipino" and "Southeast Asian" under visible minority section on census.
- Statistic includes total responses of "West Asian" and "Arab" under visible minority section on census.
- Statistic includes total responses of "Chinese", "Korean", and "Japanese" under visible minority section on census.
- Statistic includes total responses of "Visible minority, n.i.e." and "Multiple visible minorities" under visible minority section on census.
References
References
- Statistics Canada: 2011
- Statistics Canada: 2011
- Timeline for the Redistribution of Federal Electoral Districts
- Report – Alberta, archived from the original on August 24, 2021, retrieved July 2, 2013
- "New Federal Electoral Map for Alberta". Federal Electoral Districts Redistribution 2022. July 20, 2023. Archived from the original on July 27, 2023. Retrieved April 27, 2023.
- "Statistics Canada: 2011 National Household Survey Profile". May 8, 2013.
- Government of Canada, Statistics Canada (October 26, 2022). "Census Profile, 2021 Census of Population". www12.statcan.gc.ca. Retrieved March 26, 2023.
- Government of Canada, Statistics Canada (October 27, 2021). "Census Profile, 2016 Census". www12.statcan.gc.ca. Retrieved March 26, 2023.
- Government of Canada, Statistics Canada (November 27, 2015). "NHS Profile". www12.statcan.gc.ca. Retrieved March 26, 2023.
- "Forty-Fifth General Election 2025 — Poll-by-poll Results: Calgary Skyview". elections.ca. Elections Canada. 2025.
- Canada, Chief Electoral Officer (2025). "Candidate Campaign Returns, 2025 General Election: Part 3C – Summary of Electoral Campaign Expenses and Other Outflows – Election expenses subject to the limit – Total". elections.ca. Elections Canada.
Expenses are reported "as amended" where amendments have been filed; otherwise, they are reported "as submitted".
- "Transposition of Votes from the 44th General Election to the 2023 Representation Orders". Elections Canada. Retrieved April 9, 2024.
- "Forty-Fourth General Election 2021 — Poll-by-poll Results: Calgary Skyview". elections.ca. Elections Canada. 2021.
- Canada, Chief Electoral Officer (2021). "Candidate Campaign Returns, 2021 General Election: Part 3C – Summary of Electoral Campaign Expenses and Other Outflows – Election expenses subject to the limit – Total". elections.ca. Elections Canada.
Expenses are reported "as amended" where amendments have been filed; otherwise, they are reported "as submitted".
- "Forty-Third General Election 2019 — Poll-by-poll Results: Calgary Skyview". elections.ca. Elections Canada. 2019.
- Canada, Chief Electoral Officer (2019). "Candidate Campaign Returns, 2019 General Election: Part 3C – Summary of Electoral Campaign Expenses and Other Outflows – Election expenses subject to the limit – Total". elections.ca. Elections Canada.
Expenses are reported "as amended" where amendments have been filed; otherwise, they are reported "as submitted".
- "Forty-Second General Election 2015 — Poll-by-poll Results: Calgary Skyview". elections.ca. Elections Canada. 2015.
- Canada, Chief Electoral Officer (2015). "Candidate Campaign Returns, 2015 General Election: Part 4 – Campaign Financial Summary – Total election expenses subject to the limit". elections.ca. Elections Canada.
Expenses are reported "as amended" where amendments have been filed; otherwise, they are reported "as submitted".
- Pundits' Guide to Canadian Elections